Abstract
Predicting the critical buckling load of slender structural rods is essential for reliable and weight-efficient design of automotive steering and suspension linkages such as tie rods. This study evaluates the performance of four machine learning models such as artificial neural network (ANN), support vector regression (SVR), Gaussian process regression (GPR), and random forest (RF) in predicting the critical buckling load (Pcr) from geometric and material design parameters which are rod length (L), diameter (D), wall thickness (t), Young’s modulus (E), and initial geometric imperfection (δ₀). A dataset was generated using a parametric MATLAB code, and models were trained on an 80/20 train-test split with min-max normalized inputs. ANN and GPR achieved near-perfect predictive accuracy (R²=1.000), outperforming SVR and RF (R² = 0.92-0.96). Input sensitivity was assessed using permutation importance across all four models, complemented by Garson’s algorithm and the connection weight method. Rod length and diameter were consistently identified as the dominant parameters governing buckling resistance, jointly accounting for the majority of predictive importance; when length was held constant, diameter alone emerged as the leading parameter, followed by comparable contributions from wall thickness and Young’s modulus. Initial imperfection showed negligible influence according to all permutation-based methods, although the connection weight method disagreed sharply, illustrating a key limitation of weight-based sensitivity analysis relative to permutation-based approaches.
Keywords
Critical buckling load Machine learning Artificial neural network Gaussian process regression Feature importance Slender rods.
1. Introduction
Slender structural rods subjected to axial compressive loading such as automotive tie rods, connecting links, and steering linkages are highly susceptible to failure by elastic buckling rather than by material yielding, since the critical buckling load is typically reached well below the material’s ultimate strength for such geometries [1][4]. Accurate and rapid prediction of the critical buckling load (Pcr) is therefore essential for both structural design and optimization, allowing to identify the geometric and material parameters that most strongly govern buckling resistance without resorting to computationally finite element analyses for every design iteration.
Machine learning (ML) methods have increasingly been applied to structural strength and stability prediction problems, offering the ability to rapidly approximate complex, nonlinear input-output relationships once trained on a representative dataset. Among these, artificial neural networks (ANN), support vector regression (SVR), Gaussian process regression (GPR), and random forest (RF) have each shown strong performance in related structural prediction tasks, including buckling and ultimate load estimation for columns, beams, and composite structures. However, beyond raw predictive accuracy, an important question for design purposes which input parameters most strongly influence the predicted response, providing information that can guide design prioritization and weight or cost optimization [5][8].
In this study, four ML models (ANN, SVR, GPR, RF) are trained to predict the critical buckling load of a slender rod as a function of five design parameters which are length (L), diameter (D), wall thickness (t), Young’s modulus (E), and initial geometric imperfection (δ₀). Beyond comparing model accuracy, input sensitivity is assessed using multiple complementary methods such as permutation importance across all four models, and two classical ANN-specific weight-based methods, Garson’s algorithm and the connection weight method in order to establish a robust, cross-validated ranking of parameter influence rather than relying on a single importance-estimation technique. A secondary analysis, in which rod length is held constant, is further used to isolate the relative influence of the remaining parameters once the dominant geometric variable is constant. All finite element simulations and machine learning models were implemented in MATLAB R2025b software using the Deep Learning Toolbox for the ANN and the Statistics and Machine Learning Toolbox for the SVR, GPR, and Random Forest models [9].
2. Material And Method
Dataset Generation
This study considers a slender circular hollow rod under axial compressive loading, representative of an automotive tie rod. The design is characterized by four geometric and material parameters which are length (L), outer diameter (D), wall thickness (t), and Young’s modulus (E), together with an initial geometric imperfection (δ₀) representing manufacturing-induced deviation from a perfectly straight axis. The rod is modeled as a hollow circular section, with inner diameter d = D - 2t, cross-sectional area A = π(D² - d²) 4 , and second moment of area I = π(D⁴ - d⁴) 64 . A total of 5000 parameter combinations were generated, with rod length, L sampled uniformly over 300-1000 mm, outer diameter, D over 8-30 mm, and initial imperfection (δ₀) over 0-5 mm (alongside wall thickness t of 1–5 mm and Young’s modulus, E of 70,000–210,000 MPa; after excluding invalid cross-sections (d ≤ 0) and non-convergent eigenvalue solutions, a final dataset of 5000 valid specimens was retained for model training and evaluation. The rod is subjected to pinned-pinned boundary conditions: at one end, both the axial and transverse translational degrees of freedom are restrained while rotation is left free; at the opposite end, only the transverse translational degree of freedom is restrained, with the axial and rotational degrees of freedom left free to permit axial shortening under the applied compressive load. This enforces zero transverse displacement and zero moment at both ends the classical pinned-pinned column condition while avoiding an over-constrained axial condition. The rod is loaded by a compressive axial force P applied along its longitudinal axis, and its critical buckling load, Pcr is the quantity of interest predicted in this study.
Finite Element Formulation of the Buckling Analysis
The critical buckling load for each parameter combination was computed using a finite element formulation based on the linear eigenvalue buckling theory. The rod was discretized into 40 two-node Euler-Bernoulli beam elements, each possessing an elastic stiffness matrix [Ke] and a geometric matrix [Kg], assembled from the standard planar beam element formulations as given below
where Le is the element length, and P is the reference axial compressive load [10][12]. After assembling the global elastic and geometric stiffness matrices and applying the boundary conditions, the critical buckling load factor λcr was obtained by solving the generalized eigenvalue problem as
where the lowest eigenvalue λcr corresponds to the first (fundamental) buckling mode, and the critical buckling load is recovered as Pcr = λcr·Pref where λcr is critical eigenvalue or buckling load factor which is the dimensionless critical load multiplier obtained from the eigenvalue analysis, Pref is the reference load which is the reference axial load used in the analysis (defined as Pref = 1.0 in the code, a unit-magnitude load, and Pcr is the critical buckling load. The initial geometric imperfection δ₀ was introduced by prescribing an amplitude-scaled, sinusoidal (first-mode-shape) lateral offset to the nodal coordinates prior to assembly, consistent with common imperfection-sensitivity formulations for slender column buckling.
Machine Learning Models
Four regression models were trained to predict Pcr from the five input parameters. The models comprised
an artificial neural network (ANN), support vector regression (SVR), Gaussian process regression (GPR), and random forest (RF). The dataset was split into training (80%) and test (20%) subsets using a random holdout partition. All input features were normalized to the [0, 1] range using min-max scaling, with normalization parameters fitted on the training set and applied to the test set to avoid data leakage. The ANN was a feedforward network with two hidden layers of 20 and 10 neurons, trained for up to 1000 epochs using the Levenberg-Marquardt algorithm. The SVR model used a Gaussian (RBF) kernel with standardized predictors. The GPR model used an automatic relevance determination (ARD) squared-exponential kernel, allowing the per-feature length scales to be interpreted as measures of variable relevance. The RF model was an ensemble of 300 regression trees (bagged), with out-of-bag (OOB) predictor importance enabled. Model performance was evaluated on the held-out test set using the coefficient of determination (R²), root mean square error (RMSE) and mean absolute error (MAE).
2.3 Input Sensitivity - Importance Analysis
To identify which design parameters most strongly govern the critical buckling load, input importance was assessed using multiple complementary methods. Permutation importance was computed for all four models by randomly shuffling each input feature in the test set and measuring the resulting increase in RMSE, averaged over 10 repetitions per feature to reduce variance from a single random permutation. Random forest OOB importance was additionally computed as a model-native alternative, based on the increase in out-of-bag prediction error when each predictor is permuted. For the ANN specifically, two classical weight-based sensitivity methods were applied directly to the trained network weights: Garson’s algorithm [13], which decomposes the absolute-value-weighted contribution of each input across the network's hidden layers, and the connection weight method [14], which uses the signed product of weights along all input-to-output paths. Both methods were generalized from their original single-hidden-layer formulation to the two-hidden-layer architecture used here by chaining the layer-wise weight matrices. All importance scores were normalized to sum to 100% within each method for comparability across models.
3. Results
Model Performance
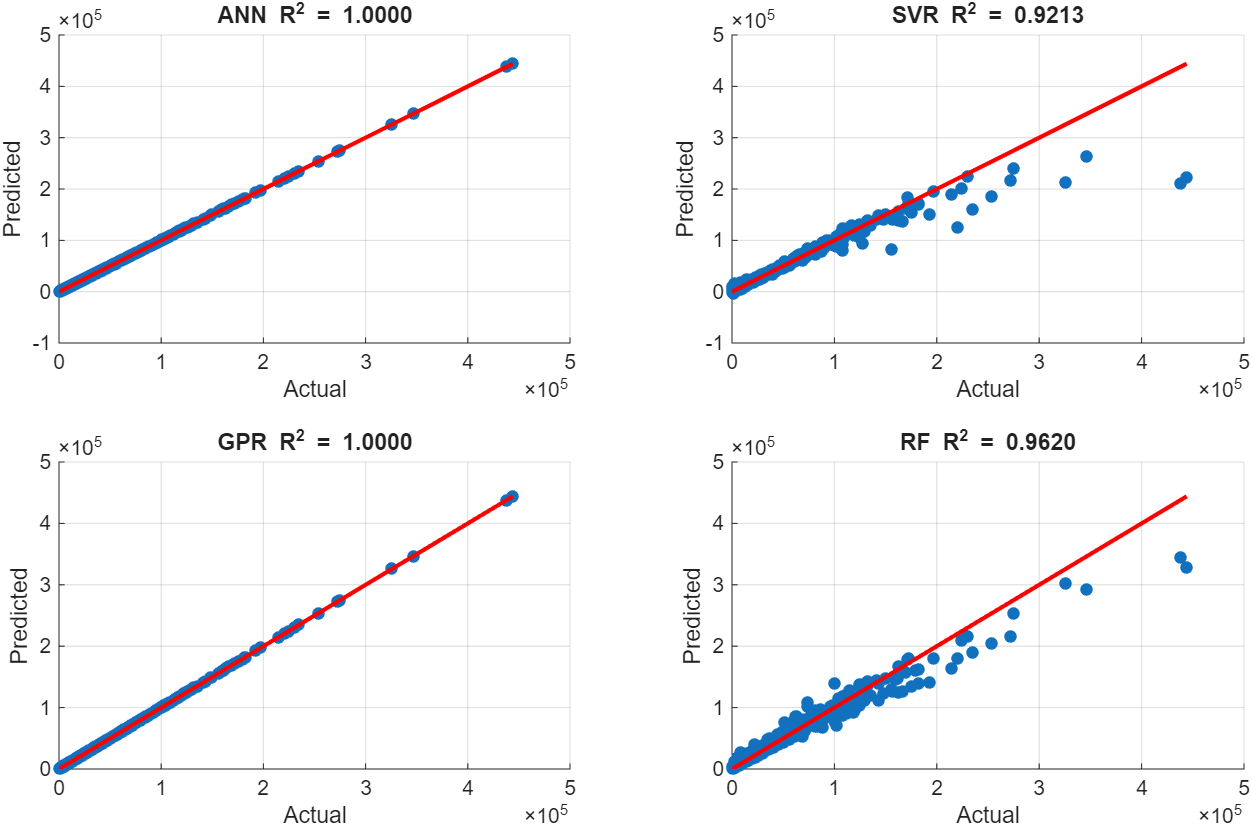
The ANN and GPR models achieved near-perfect agreement with the analytically computed Pcr values (R² =1.0000), reflecting the fact that both models are well-suited to capturing the smooth, deterministic input-output relationship defined by the underlying analytical buckling formula. SVR and RF also performed well (R²=0.92 and 0.96, respectively) but showed higher prediction error, particularly at higher Pcr values, indicating comparatively greater difficulty capturing the nonlinearity and scale of the response across the full range of the dataset. Based on the combination of the lowest RMSE and MAE, the ANN was selected as the best-performing model. Table 1 summarizes the predictive performance of the four models on the held-out test set.
| Model | R² | RMSE | MAE |
| ANN | 1.0000 | 7.86 | 4.38 |
| SVR | 0.9213 | 12,883 | 3315.2 |
| GPR | 1.0000 | 78.10 | 44.84 |
| Random Forest | 0.9620 | 8949.9 | 3991.0 |
Because the dataset was generated from a closed-form analytical relationship rather than physical or finite-element experiments, the near-unity R² values obtained here reflect the models’ capacity to approximate a known deterministic function rather than generalization under measurement or manufacturing variability.
Figure 1 illustrates the predicted-versus-actual agreement for each model on the test set. The ANN and GPR predictions (Figures 1a and 1c) fall almost exactly on the identity line across the full range of Pcr values, whereas the SVR and RF predictions (Figures 1b and 1d) show visibly increasing scatter at higher Pcr values, consistent with their lower R² scores.
Input Importance
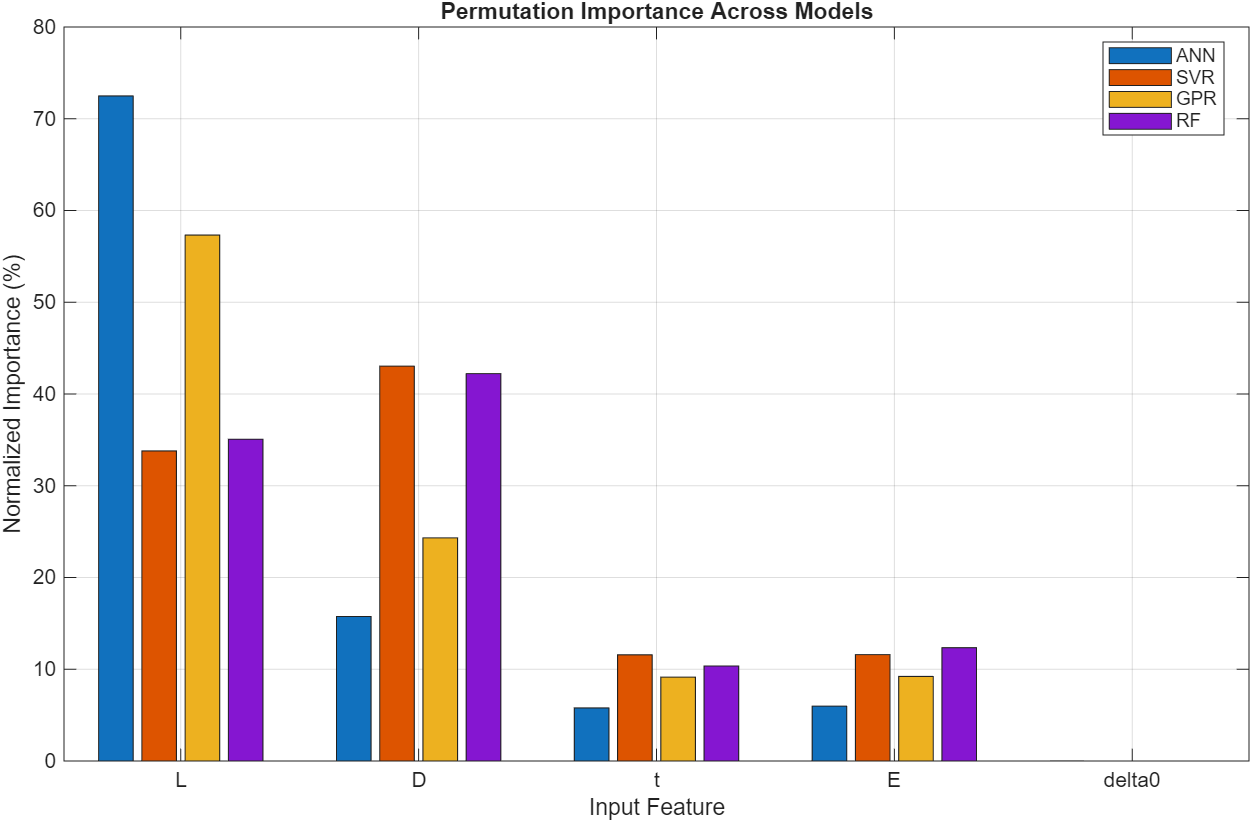
Across all seven importance metrics and four independent models, rod length (L) and diameter (D) consistently emerged as the two dominant parameters governing the critical buckling load, together accounting for approximately 53.92-88.24% of total importance depending on the method. Thickness (t) and Young’s modulus (E) contributed moderately and comparably across most methods about 6-25%, while the initial imperfection (δ₀) showed negligible influence in every method except the connection weight method (8.83%), where it still remained the least important parameter overall. Table 2 presents the normalized input importance obtained from each method. The consistency of this ranking across permutation-based (model-agnostic) and weight-based (Garson, connection weight) methods strengthens confidence that the observed sensitivity pattern reflects the underlying physical relationship rather than an artifact of any single model or importance-estimation technique.
| Parameter | ANN (perm.) | SVR (perm.) | GPR (perm.) | RF (perm.) | RF (OOB) | Garson (ANN) | Connection Weight (ANN) |
| L | 72.49 | 33.80 | 57.32 | 35.07 | 33.70 | 32.64 | 42.13 |
| D | 15.75 | 43.04 | 24.32 | 42.22 | 39.37 | 21.28 | 16.10 |
| t | 5.78 | 11.57 | 9.14 | 10.36 | 13.18 | 24.92 | 0.41 |
| E | 5.98 | 11.60 | 9.22 | 12.35 | 13.51 | 20.37 | 32.53 |
| δ₀ | 0.01 | 0.00 | 0.00 | 0.00 | 0.25 | 0.79 | 8.83 |
Figure 2 compares the normalized permutation importance of the five input parameters across all four models, confirming that L and D dominate the response while δ₀ contributes negligibly regardless of the model used. Figure 3 further examines this pattern specifically for the ANN by comparing permutation importance against two weight-based methods (Garson, connection weight); while the relative ranking of L and D as the two most influential geometric parameters is broadly preserved, the three methods disagree noticeably on the role of t and E, Garson assigns t a substantially higher importance (24.92%) than permutation does (5.78%), while the connection weight method instead favors E (32.53%) over t (0.41%). This divergence is expected because permutation importance reflects the network’s actual predictive sensitivity including nonlinear and interaction effects, whereas Garson and connection weight are computed purely from the trained weight matrices and rest on a linear-path assumption that does not account for the network’s nonlinear activation functions. Regardless of method, δ₀ remains the least influential parameter throughout.
Sensitivity Analysis with Fixed Rod Length (L = 300 mm)
To isolate the effect of the remaining design parameters once the dominant geometric variable was fixed, a second dataset was generated with rod length held constant at L=300 mm, and the same modeling and importance-analysis pipeline was repeated using diameter (D), wall thickness (t), Young’s modulus (E), and initial imperfection (δ₀) as inputs. Figure 4 illustrates the predicted-versus-actual agreement for each model on the test set under the fixed-L scenario. As in the full five-parameter analysis, the ANN and GPR predictions (Figures 4a and 4c) closely follow the identity line across the tested range, while the SVR and RF predictions (Figures 4b and 4d) exhibit visibly greater scatter, particularly toward higher Pcr values which is consistent with their lower R² scores reported in Table 3.
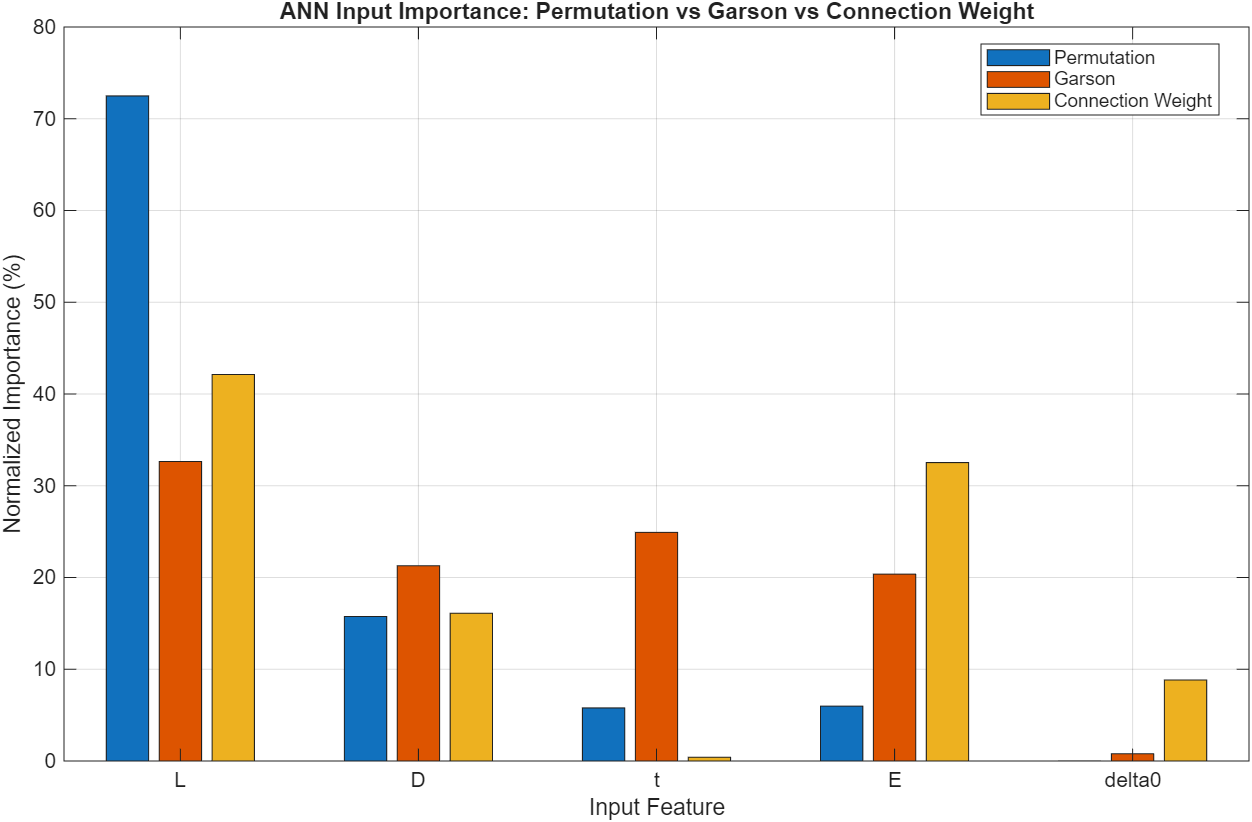
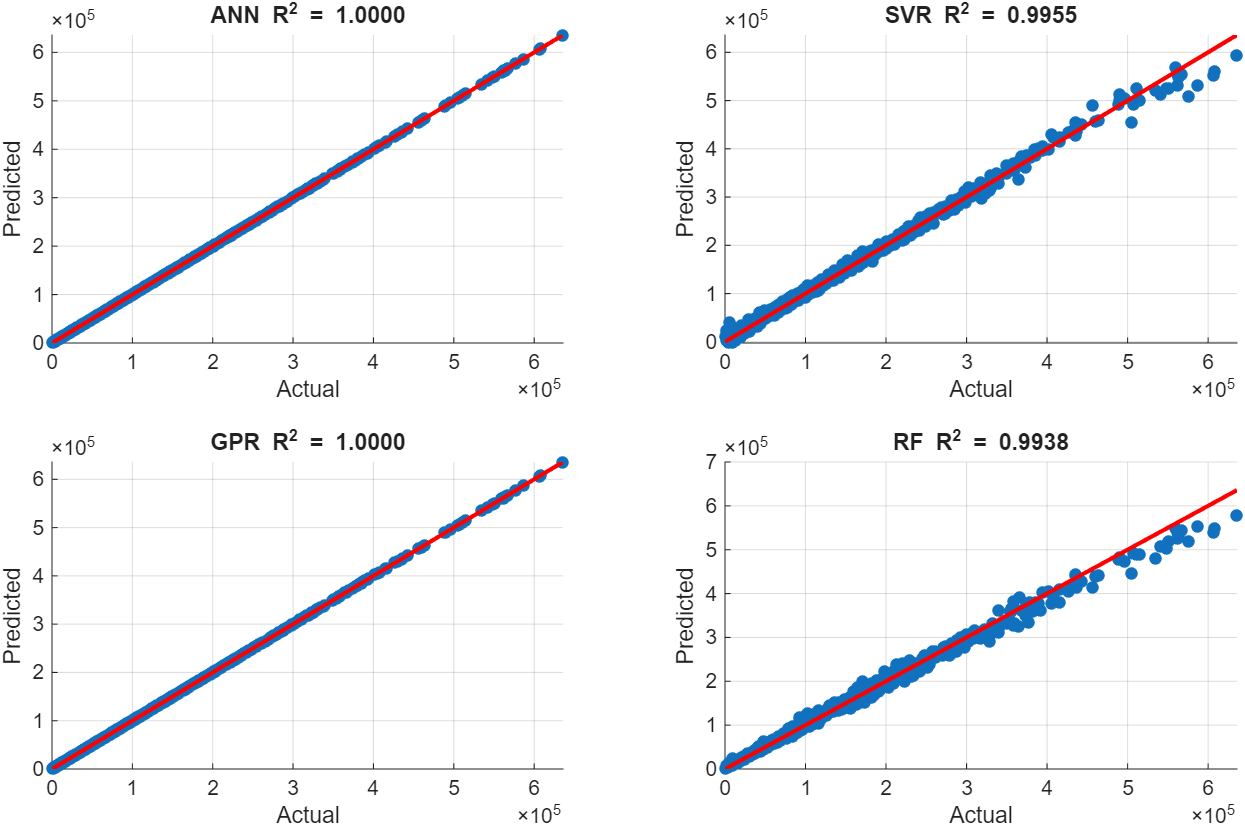
Figure 5 compares the normalized permutation importance of the four remaining input parameters across all four models. Diameter (D) emerges as the dominant parameter across every model (54.5-63.4%), followed by comparable contributions from t and E (about 18-24% each), while δ₀ contributes negligibly (0.01-2.04%) regardless of model confirming that, once rod length is fixed, diameter becomes the primary geometric driver of critical buckling load.
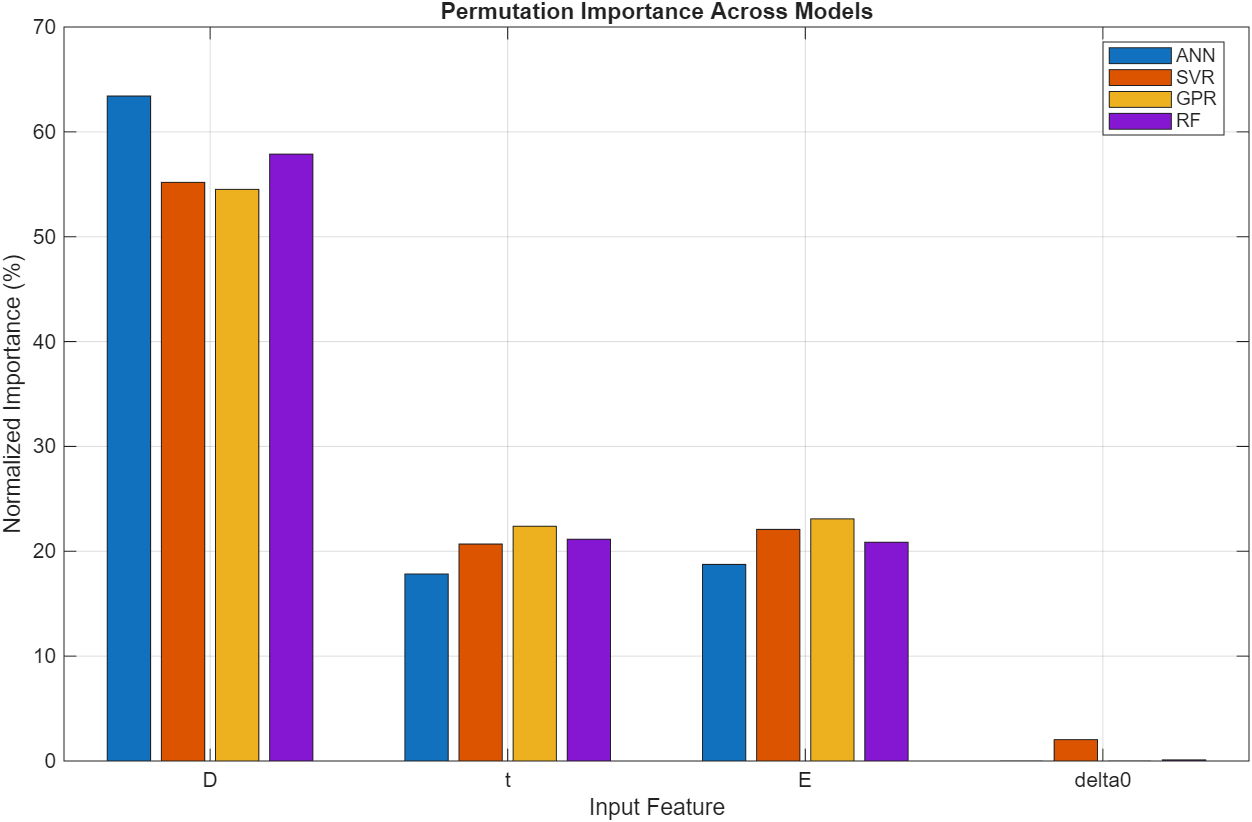
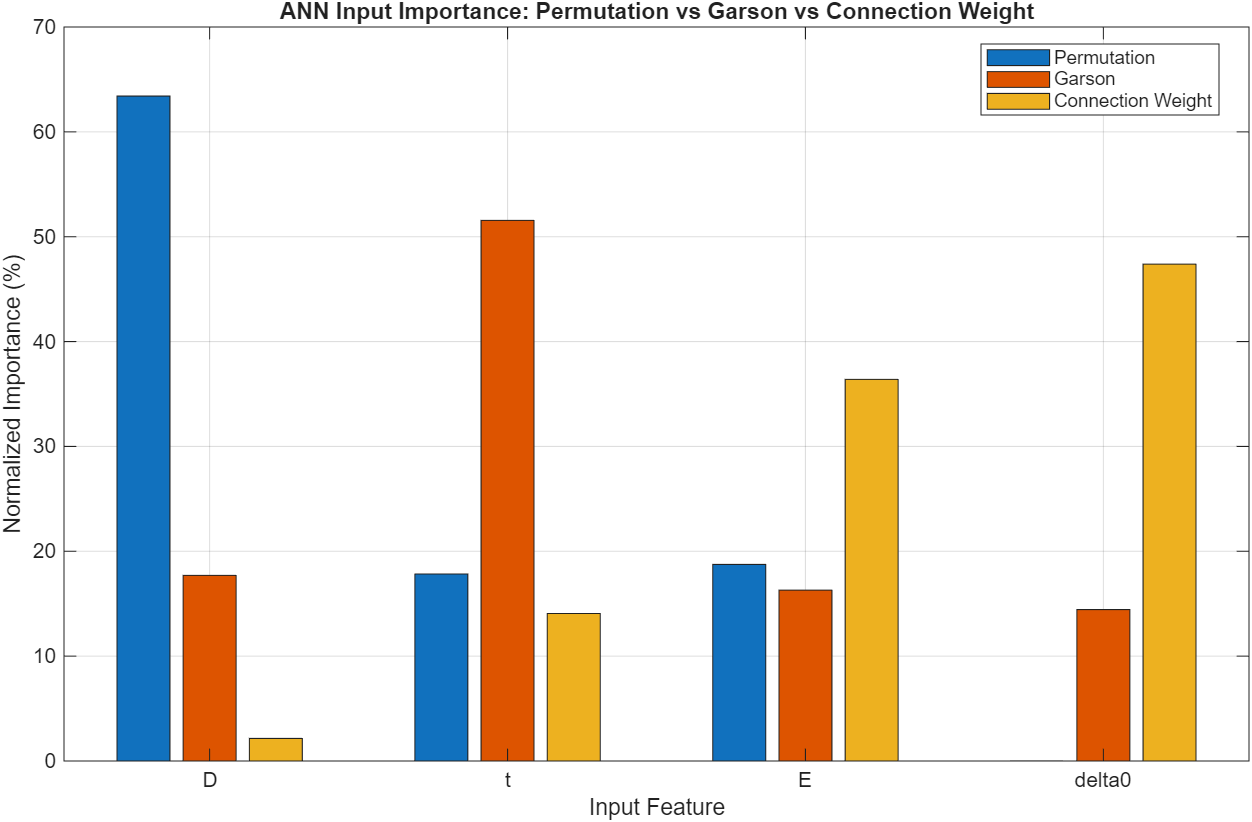
Figure 6 examines this pattern specifically for the ANN by comparing permutation importance against the two weight-based methods (Garson, connection weight). While all three methods agree that D remains an important parameter, they diverge sharply on δ₀: permutation importance ranks it as negligible, whereas the connection weight method assigns it the highest importance of all four parameters (47.4%) and Garson’s algorithm ranks it third (14.4%). This divergence is attributed to the weight-based methods’ sensitivity to raw connection-weight magnitude rather than to the actual variance of each input within the sampled dataset.
Model Performance with Fixed Rod Length (L = 300 mm)
Since rod length was identified as the most influential parameter in the full five-parameter analysis, it was held constant at a representative value (L = 300 mm) in this scenario to isolate the relative influence of the remaining design parameters (diameter, wall thickness, Young‘s modulus, and initial imperfection) independent of the dominant length effect. Table 3 summarizes the predictive performance of the four models on the test set for the scenario of L=300 mm.
| Model | R² | RMSE | MAE |
| ANN | 1.0000 | 127.28 | 87.381 |
| SVR | 0.9955 | 8112.2 | 5750.1 |
| GPR | 1.0000 | 80.145 | 52.03 |
| Random Forest | 0.9938 | 9511.5 | 5360.0 |
As seen from the table, both ANN and GPR achieved well agreement with the analytical Pcr values (R²= 1.0000); GPR was marginally superior in absolute terms, achieving a lower RMSE (80.15 vs. 127.28) and MAE (52.03 vs. 87.38), and was therefore selected as the best-performing model for this scenario. SVR and RF again showed comparatively higher error (RMSE approximately two orders of magnitude larger than ANN/GPR), consistent with the pattern observed in the full five-parameter analysis.
Input Importance with Fixed Rod Length (L = 300 mm)
Table 4 presents the normalized input importance of the four remaining parameters (D, t, E, δ₀) under this scenario, obtained via permutation importance across all four models and via the Garson and connection weight methods for the ANN. With L removed as a variable, diameter D emerged as the single most influential parameter across all four permutation-based methods (54.51–63.41%), followed by comparable contributions from t and E. This is consistent with the dominant role of L and D identified in the full five-parameter analysis: once length is fixed, diameter becomes the primary geometric driver of critical buckling load. The initial imperfection (δ₀) again showed negligible influence according to every permutation-based method, regardless of the underlying model (0.01-2.04%). However, the two ANN weight-based methods diverged sharply from this result: Garson’s algorithm assigned δ₀ a moderate importance (14.44%), while the connection weight method ranked it as the most influential parameter overall (47.39%) directly contradicting the permutation-based evidence. This discrepancy is attributed to a known limitation of weight-based sensitivity methods: both Garson's algorithm and the connection weight method quantify importance purely from the magnitude of the trained network weights, without accounting for the actual range of variation of each input in the dataset. Because δ₀ was sampled over a comparatively narrow range relative to the other parameters, the network may assign it disproportionately large weights without this translating into meaningful predictive sensitivity a distinction that permutation importance, which directly measures the effect of perturbing each feature within its real data distribution, correctly captures. Given this inconsistency, the permutation-based ranking is taken as the primary evidence for parameter sensitivity in this study, and the Garson and connection weight scores for δ₀ are reported only for completeness and should not be interpreted as evidence of a genuine physical effect.
| Parameter | ANN (perm.) | SVR (perm.) | GPR (perm.) | RF (perm.) | RF (OOB) | Garson (ANN) | Connection Weight (ANN) |
| D | 63.41 | 55.19 | 54.51 | 57.88 | 48.11 | 17.70 | 2.15 |
| t | 17.83 | 20.69 | 22.39 | 21.15 | 24.21 | 51.56 | 14.07 |
| E | 18.75 | 22.08 | 23.09 | 20.87 | 27.52 | 16.30 | 36.39 |
| δ₀ | 0.01 | 2.04 | 0.01 | 0.11 | 0.15 | 14.44 | 47.39 |
4. Conclusions
This study evaluated the ability of four machine learning models artificial neural network (ANN), support vector regression (SVR), Gaussian process regression (GPR), and random forest (RF) to predict the critical buckling load (Pcr) of a slender rod as a function of geometric and material design parameters, and to identify which parameters govern this response. The following conclusions can be drawn:
1. Predictive performance: All four models achieved well agreement with the analytically generated dataset. ANN and GPR consistently achieved the highest accuracy (R²=1.0000 in both the full five-parameter and fixed-L scenarios), with GPR showing a marginally lower RMSE and MAE overall. SVR and RF also performed well (R² ≥ 0.92) but with noticeably higher prediction error, particularly toward the upper end of the Pcr range, indicating comparatively greater difficulty capturing the full nonlinearity and scale of the response.
2. Dominant design parameters: Across all permutation-based importance methods and all four models, rod length (L) and diameter (D) were consistently identified as the two most influential parameters governing critical buckling load, jointly accounting for the majority of predictive importance. When L was held constant at 300 mm to isolate the remaining variables, diameter (D) emerged as the single dominant parameter, followed by comparable contributions from wall thickness (t) and Young's modulus (E) confirming that geometric parameters, rather than material stiffness alone, primarily control the buckling response in this design space.
3. Negligible role of initial imperfection: The initial geometric imperfection (δ₀) showed consistently negligible influence on Pcr across every permutation-based method and every model, in both the full and fixed-L scenarios. This suggests that, within the sampled parameter ranges, δ₀ contributes little practical sensitivity to the predicted buckling load relative to the dominant geometric parameters.
4. Limitations of weight-based sensitivity methods: Garson’s algorithm and the connection weight method applied specifically to the trained ANN did not always agree with the permutation-based rankings, most notably for δ₀, which the connection weight method identified as the most influential parameter (47.4%) despite permutation importance ranking it as essentially negligible across all models. This divergence highlights an important methodological caveat: weight-based methods reflect the magnitude of the trained network’s internal weights rather than the actual sensitivity of the output to realistic variation in each input and can therefore overstate the importance of parameters sampled over a narrow range. Accordingly, permutation importance is recommended as the primary basis for parameter-sensitivity conclusions in this class of problem, with weight-based methods retained only as a secondary, model-specific diagnostic.
Results indicate that study to improve buckling resistance should prioritize rod length and diameter, as these parameters offer the greatest leverage over critical buckling load, while refinements to material selection (E) and wall thickness (t) offer secondary, comparatively smaller gains, and manufacturing control of initial imperfection (δ₀) appears to be of limited consequence within the ranges considered.
Author contributions The authors declare that they contributed equally to the research and preparation of this article.
Funding Not applicableData availability statement Not applicable
DeclarationsConflict of interest. The authors declare that they have no known competing financial interests or personal relationships that could have appeared to influence the work reported in this paper.
References
- Timoshenko, S.P., Gere, J.M. Theory of Elastic Stability. 1961. 2nd edition. McGraw-Hill, New York. DOI ↗ Google Scholar ↗
- Owunna, I., Ikpe, A. E., Ebunilo, P. O., Ikpe, E. E. Investigation of a vehicle tie rod failure in relation to the forces acting on the suspension system. American Journal of Engineering Research (AJER). 2016; 5 (6): 208-217. DOI ↗ Google Scholar ↗
- Falah, A.H., Alfares, M.A., Elkholy, A.H. Failure investigation of a tie rod end of an automobile steering system. Engineering Failure Analysis; 2007; 14(5):895-902. DOI ↗ Google Scholar ↗
- Jiang, G., Zhang, Y., Xu, X., Ding, D. Stability and failure analysis of steering tie rod. Proc. SPIE 7375, ICEM. 2008: International Conference on Experimental Mechanics 2008, 73753A (25 Aug 2009). DOI ↗ Google Scholar ↗
- Majumder, R., De, B., Gupta, A.D., Mishra, S.K. A data-driven assessment of buckling strength reduction in truncated conical shells: development of a hybrid Gaussian process-XG boost machine learning framework. Data-Centric Engineering. 2026; 7: e14. doi:. DOI ↗ Google Scholar ↗
- Megahed, K., Mahmoud, N.S., Abd-Rabou, S.E.M. Application of machine learning models in the capacity prediction of RCFST columns. Scientific Reports. 2023;13: 20878. DOI ↗ Google Scholar ↗
- Kaveh, A., Dadras Eslamlou, A., Javadi, S.M., Geran Malek, N. Machine learning regression approaches for predicting the ultimate buckling load of variable-stiffness composite cylinders. Acta Mech. 2021; 232: pp: 921-931. DOI ↗ Google Scholar ↗
- Degtyarev, V. V., Tsavdaridis, K. D. Buckling and ultimate load prediction models for perforated steel beams using machine learning algorithms. Journal of Building Engineering. 2022; 51(2): 104316. DOI ↗ Google Scholar ↗
- MATLAB (R2025b). The MathWorks, Inc., Natick, Massachusetts, United States. DOI ↗ Google Scholar ↗
- Gören Kıral, B. Static and Dynamic Stability Analyses of the Symmetric Laminated Cantilever Beams. Advanced Composites Letters. 2008; 17 (5):155-160. DOI ↗ Google Scholar ↗
- Gören Kıral, B., Kıral, Z., Öztürk, H. Stability analysis of delaminated composite beams. Composites Part B: Engineering. 2015; 79: 406-418. DOI ↗ Google Scholar ↗
- Gören, B. Static Stability Analysis of a Linearly Tapered Cantilever Beam using the Finite Element. MSc Thesis, Dokuz Eylül University, Graduate School of Natural and Applied Sciences, Department of Mechanical Engineering. 1999; Izmir, Türkiye. DOI ↗ Google Scholar ↗
- Garson, G.D. Interpreting Neural Network Connection Weights. AI Expert. 1991; 6: 47-51. DOI ↗ Google Scholar ↗
- Olden, J.D. and Jackson, D.A. Illuminating the “black box”: a randomization approach for understanding variable contributions in artificial neural networks. Ecological Modelling. 2002; 154(1-2):135-150. DOI: DOI ↗ Google Scholar ↗