Abstract
The rapid advancement of digital technologies has significantly transformed educational systems, necessitating that public elementary schools and their teachers develop strong digital aptitudes and engage in professional collaboration supported by effective administrative leadership. These changes, underscored by national policies such as the Enhanced Basic Education Act of 2013, expand teachers' roles beyond traditional instruction to include technological proficiency, teamwork, and responsiveness to organizational demands. Teacher fulfillment—encompassing satisfaction, motivation, and professional well-being—is crucial for sustained instructional effectiveness but has seldom been studied in relation to the combined impact of digital skills, collaboration, and administrative support, especially within localized contexts like the Division of Pasig City. This study seeks to fill that gap by assessing stakeholders’ perceptions, examining interrelationships among these factors, identifying challenges, and proposing capacity development strategies to enhance teacher competencies, organizational support, and ultimately, educational outcomes in public elementary schools.
Keywords
DIGITAL APTITUDES PROFESSIONAL COLLABORATION AND ADMINISTRATIVE SUPPORT AND TEACHERS’ FULFILLMENT
The Problem and Its Setting
Introduction
The rapid evolution of digital technology has reshaped the global educational landscape, altering the way teaching is delivered, learning is experienced, and schools are managed. Philippine public elementary schools have been at the forefront of this shift, working to sustain quality education within an increasingly technology-driven environment. As the central agents of this transformation, teachers are expected not merely to integrate digital tools into their instructional practices but also to collaborate meaningfully with colleagues and function within administrative structures that support their growth. How well teachers navigate this digital shift largely determines whether the promise of technological advancement translates into better learning outcomes and stronger school performance.
In support of this shift, national legislation has underscored the importance of building teachers' digital competence, strengthening professional collaboration, and
ensuring dependable administrative support. Republic Act No. 10533, otherwise known as the Enhanced Basic Education Act of 2013, calls for the continuous enhancement of teachers' professional skills and the meaningful integration of technology in the classroom as a means of improving the quality of basic education. The law reflects the government's commitment to preparing educators for twenty-first-century learning and affirms that teacher empowerment and school development must be pursued as system-wide, rather than isolated, efforts.
Within this legislative and technological context, digital aptitude, as used in this study, refers to the broad range of skills and knowledge that allow educators to use digital technology with confidence and responsibility in their professional work. It begins with digital literacy—the basic ability to operate devices and software—and extends to instructional technology integration and online classroom management, through which teachers embed technology into curriculum delivery and engage learners in virtual settings. It further includes content creation and curation,
cybersecurity awareness, digital communication, the use of educational platforms, problem-solving in digital contexts, adaptability to emerging technologies, digital ethics, data management, and digital survival skills. Taken together, these sub-competencies form the multifaceted digital aptitude that today's classroom teacher needs.
Digital competence alone, however, does not operate in a vacuum. Professional collaboration and administrative support are organizational factors that shape the teaching environment just as strongly and, in turn, influence educational outcomes. Specifically, professional collaboration is expressed through a shared vision and common goals among school personnel, collaborative planning, teamwork, and open communication that enable collective problem-solving and the exchange of ideas. Administrative support, meanwhile, is expressed through instructional leadership, supervisory guidance, the provision of resources, recognition and motivation, and attention to teacher well-being. Where both are present, an enabling environment tends to follow—one that sustains teacher engagement, retention, and performance.
Ultimately, these organizational supports converge on teachers' fulfillment, understood here as their level of satisfaction, motivation, and professional well-being, and the outcome that most clearly reveals how well an educational system supports the people who run its classrooms. It shows itself in instructional delivery and classroom management, learner engagement, assessment and feedback practices, commitment to continuous professional growth, and involvement with the wider school community. Where fulfillment is high, job satisfaction tends to rise and burnout tends to fall, along with a corresponding improvement in instructional quality, making fulfillment a meaningful indicator of a healthy and productive school environment.
Despite this growing recognition, a gap remains in understanding how digital aptitude, professional collaboration, and administrative support interact to shape teachers' fulfillment, particularly within the local context of the Division of Pasig City. Much of the existing literature treats these variables separately or examines them through the perspective of a single stakeholder group, leaving their
interplay insufficiently explored.
Moreover, as reforms continue and technological integration in schools deepens, it becomes increasingly important to understand the challenges and opportunities experienced by the full range of educational personnel—supervisors, school heads, teachers, and non-teaching staff alike. Closing this gap offers empirical grounding for a capacity development plan that can strengthen teacher competencies, improve organizational support, and, ultimately, serve the quality of education that learners receive.
Theoretical Framework
This study is anchored on three theories: the Technological Pedagogical Content Knowledge (TPACK) Theory of Mishra and Koehler (2006), the Social Capital Theory of Coleman (1988) and Putnam (2000), and the Self-Determination Theory (SDT) of Deci and Ryan (1985).
The TPACK Theory developed by Mishra and Koehler (2006) posits that effective teaching is contingent upon the seamless integration of three core knowledge domains: technology, pedagogy, and content. It emphasizes that teachers must not
only understand the subject matter (content knowledge) and effective teaching strategies (pedagogical knowledge) but also how to integrate digital technologies appropriately to enhance learning. This theory underpins the study’s focus on digital aptitudes, highlighting the need for teachers to develop competencies in using digital tools and platforms effectively within their instructional practices. By adopting this framework, the study acknowledges that digital proficiency is not just about technical skills but also about how technology complements pedagogy and content delivery.
The Social Capital Theory, as introduced by Coleman (1988) and further expanded by Putnam (2000), stresses the value of social networks, trust, norms, and collaboration for the functioning of organizations and communities. In the context of schools, social capital manifests through strong professional relationships, mutual trust, shared goals, and supportive leadership, all of which facilitate effective communication and collective problem-solving. This theory aligns with the variable professional collaboration and administrative support in this study, illustrating how social
capital within the school environment can enhance teamwork, resource sharing, and teacher morale. It provides a theoretical lens to understand how collective efforts and organizational support can boost teachers' professional experiences and outcomes.
The Self-Determination Theory (SDT) by Deci and Ryan (1985) focuses on human motivation and the psychological needs that drive fulfillment: autonomy, competence, and relatedness. According to SDT, individuals experience higher motivation and well-being when these needs are satisfied. Applied to education, teachers are more likely to feel professionally fulfilled when they perceive themselves as competent in their work, have the autonomy to make instructional decisions, and feel connected to their colleagues and the school community. This theory undergirds the dependent variable of this study—teachers’ fulfillment—by offering insight into the motivational aspects that contribute to their job satisfaction, engagement, and sustained productivity.
The three theories were deemed appropriate for this study as each directly addresses a core component of the research
framework. The TPACK Theory corresponds with the investigation of digital aptitudes by emphasizing technological integration in teaching. Social Capital Theory explicates the dynamics of professional collaboration and administrative support by highlighting the significance of social relationships and trust in organizational effectiveness. Finally, the Self-Determination Theory explains the psychological basis for teachers’ fulfillment and motivation within their professional environment. Together, these theories offer a comprehensive conceptual foundation to explore how the development of digital competencies and supportive school climates influence teacher satisfaction and effectiveness.
Anchoring this theoretical framework is the legal basis provided by Republic Act No. 10533, the Enhanced Basic Education Act of 2013. This legislation mandates continuous professional development for teachers, the integration of technology in instruction, and the establishment of supportive educational environments that encourage collaboration and leadership. The act reinforces the necessity of grounding the study in theories that highlight technological competence,
social collaboration, and personal motivation, thereby ensuring that the research aligns with national policies aimed at improving the quality of basic education through teacher empowerment and organizational support.
Conceptual Framework
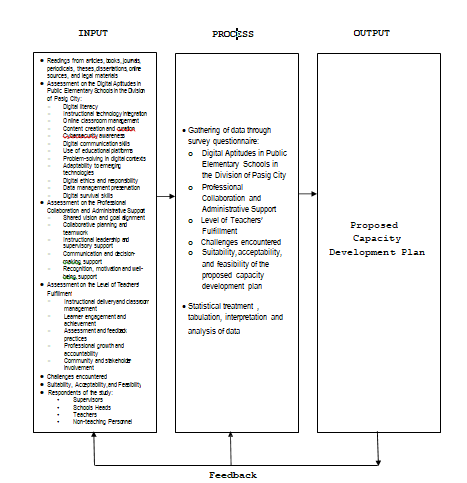
Building on the theories discussed above, this section presents the conceptual framework that guided the conduct of the study. It translates the relationships among digital aptitude, professional collaboration, administrative support, and teachers' fulfillment into a single research paradigm, structured around the Input-Process-Output (IPO) model, from which the proposed capacity development plan was ultimately derived.
The Input consists of the literature and studies reviewed—books, journals, periodicals, theses, and online sources—together with survey data on digital aptitude, professional collaboration and administrative support, and teachers' fulfillment in public elementary schools in the Division of Pasig City. It also includes the challenges reported by respondents and the criteria of suitability, acceptability,
and feasibility against which the proposed capacity development plan would be judged. The respondents comprised supervisors, school heads, teachers, and non-teaching personnel.
Building on this input, the Process covers the gathering of data through a survey questionnaire and the assessment of each study variable. Digital aptitude is examined across digital literacy, instructional technology integration, online classroom management, content creation and curation, cybersecurity awareness, digital communication skills, use of educational platforms, problem-solving in digital contexts, adaptability to emerging technologies, digital ethics and responsibility, data management preservation, and digital survival skills. Professional collaboration and administrative support are examined through shared vision and goal alignment, collaborative planning and teamwork, instructional leadership and supervisory support, communication and decision-making support, and recognition, motivation, and well-being support. Teachers' fulfillment, meanwhile, is examined through instructional delivery and classroom management, learner
engagement and achievement, assessment and feedback practices, professional growth and accountability, and community and stakeholder involvement. This stage also involves identifying the challenges respondents encounter, applying the appropriate statistical treatment, and analyzing and interpreting the resulting data.
Finally, the Output is the proposed capacity development plan, formulated from the findings of the input and process stages to strengthen teachers' digital aptitude, reinforce professional collaboration and administrative support, and raise the level of teachers' fulfillment in public elementary schools in the Division of Pasig City.
Statement of the Problem
This study sought to determine the digital aptitude, professional collaboration, administrative support, and teachers' fulfillment in public elementary schools in the Division of Pasig City as a basis for a capacity development plan.
Specifically, it sought to answer the following questions:
-
How do supervisors, school heads, teachers, and non-teaching personnel assess the digital aptitude of teachers in public elementary schools in the Division of Pasig City in terms of:
-
Digital Literacy
-
Instructional Technology Integration
-
Online Classroom Management
-
Content Creation and Curation
-
Cybersecurity Awareness;
-
Digital Communication Skills
-
Use of Educational Platforms;
-
Problem-Solving in Digital Contexts
-
Adaptability to Emerging Technologies
-
Digital Ethics and Responsibility
-
Data Management Preservation
-
Digital Survival Skills?
-
How do the four groups of respondents assess professional collaboration and administrative support in terms of:
-
Shared Vision and Goal Alignment
-
Collaborative Planning and Teamwork
-
Instructional Leadership and Supervisory Support
-
Communication and Decision-Making Support
-
Recognition, Motivation, and Well-Being Support?
-
Is there a significant difference among the assessments of the four groups of respondents as to the variables above?
-
What is the level of teachers' fulfillment in terms of:
-
Instructional Delivery and Classroom Management
-
Learner Engagement and Achievement
-
Assessment and Feedback Practices
-
Professional Growth and Accountability
-
Community and Stakeholder Involvement?
-
Is there a significant relationship among digital aptitude, professional collaboration and administrative support, and teachers' fulfillment?
-
What challenges do the respondents encounter with respect to digital aptitude and professional collaboration, and administrative support?
-
Based on the findings, what capacity development plan may be proposed?
-
How suitable, acceptable, and feasible is the proposed
capacity development plan?
Hypotheses
The study tested the following null hypotheses:
-
There is no significant difference among the assessments of supervisors, school heads, teachers, and non-teaching personnel as to digital aptitude, professional collaboration, and administrative support in public elementary schools in the Division of Pasig City.
-
There is no significant relationship among digital aptitude, professional collaboration, administrative support, and teachers' fulfillment.
Scope and Limitation of the Study
This study focused on determining the levels of digital aptitude, professional collaboration, and administrative support, and teachers' fulfillment in public elementary schools in the Division of Pasig City, as a basis for developing a capacity development plan. Digital aptitude was examined in terms of digital literacy, instructional technology integration, online classroom management, content creation and curation, cybersecurity awareness, digital
communication skills, use of educational platforms, problem-solving in digital contexts, adaptability to emerging technologies, digital ethics and responsibility, data management preservation, and digital survival skills. Professional collaboration and administrative support were assessed in terms of shared vision and goal alignment, collaborative planning and teamwork, instructional leadership and supervisory support, communication and decision-making support, and recognition, motivation, and well-being support. Teachers' fulfillment, in turn, was examined in relation to instructional delivery and classroom management, learner engagement and achievement, assessment and feedback practices, professional growth and accountability, and community and stakeholder involvement.
In terms of respondents, the study drew on eight (8) district supervisors, fifteen (15) school heads, four hundred twelve (412) teachers, and eighteen (18) non-teaching personnel, for a total sample of four hundred fifty-three (453).
These respondents were drawn from fifteen (15) public elementary schools in the Division of Pasig City: : Bagong Ilog Elementary School, Bambang Elementary School, Caniogan Elementary School, De Castro Elementary School Pasig Elementary School, Ilugin Elementary School, Kalawaan Elementary School, Liberato Damian Elementary School, Manggahan Elementary School, Maybunga Elementary School, Nagpayong Elementary School, Palatiw Elementary School, Pasig Elementary School, Pinagbuhatan Elementary School, Sagad Elementary School, and San Miguel Elementary School. Data collection ran from November 2025 to June 2026, using a researcher-made survey questionnaire administered face-to-face or online, depending on respondents' accessibility and availability.
Finally, the study was delimited to the perceptions of respondents from the selected public elementary schools in the Division of Pasig City and did not extend to private schools, secondary schools, students, parents, or personnel outside the selected institutions.
Significance of the Study
This study is expected to benefit the following:
Department of Education (DepEd). The findings may inform policy formulation, program design, and resource allocation aimed at strengthening digital skills, collaboration, administrative support, and teacher fulfillment in public elementary schools.
Supervisors. The results may support planning, monitoring, and mentoring activities suited to the needs of the schools and personnel under their supervision.
School heads. The results may help strengthen instructional leadership, build stronger teamwork, and improve the support systems that contribute to better school performance.
Teachers. The findings may help them identify their strengths and areas for growth in digital skills and professional collaboration, supporting greater effectiveness and job satisfaction.
Non-teaching personnel. The study may deepen their understanding of the role they play in supporting digital programs and teamwork that contribute to school success.
Learners. The study may contribute to better learning experiences and outcomes through improved teaching practices and greater teacher fulfillment.
Parents and guardians. The findings may encourage a more responsive and supportive learning environment attuned to their children's developmental needs.
Future researchers. The study may serve as a reference for further research on digital aptitude, professional collaboration, administrative support, teacher fulfillment, and capacity building in education.
Definition of Terms
The following terms are defined operationally and conceptually for a common understanding of the study:
Adaptability to emerging technologies refers to the ability to adjust to and make effective use of new and evolving digital technologies in carrying out educational and professional tasks (OECD, 2023).
Assessment and feedback practices refer to the methods teachers use to evaluate learner performance and provide
feedback that supports improvement. In this study, this is one of the indicators of teachers' fulfillment.
Capacity development plan refers to the intervention program proposed in this study, based on its findings, to strengthen digital aptitude, professional collaboration, administrative support, and teachers' fulfillment.
Challenges encountered refer to the difficulties or barriers respondents experience in relation to digital aptitude, professional collaboration, and administrative support.
Collaborative planning and teamwork refer to the process of working with colleagues to plan, implement, and evaluate school programs and instructional activities.
Communication and decision-making support refers to the assistance school leaders provide through effective communication systems and participatory decision-making.
Community and stakeholder involvement refers to the participation of parents, community members, and other stakeholders in supporting school programs and learner
development. In this study, it is one dimension of teachers' fulfillment.
Content creation and curation refer to the development, selection, organization, and management of digital learning resources and instructional materials (Singh, 2025).
Cybersecurity awareness refers to the knowledge of safe digital practices used to protect information, devices, and systems from cyber threats (Dawson, 2018).
Data management preservation refers to the proper organization, storage, protection, and maintenance of digital records to ensure their accessibility, accuracy, and security (Miller & Scott, 2025).
Digital aptitude refers to the competencies and capabilities of teachers and school personnel in using digital technology to carry out instructional, administrative, and professional functions (Khare et al., 2022).
Digital communication skills refer to the ability to exchange information and interact with others effectively through digital platforms and communication technologies (Han & Zhang, 2020).
Digital ethics and responsibility refer to the appropriate and responsible use of digital technology, with due regard for privacy, intellectual property rights, and digital citizenship (Bankins & Formosa, 2021).
Digital literacy refers to the ability to access, evaluate, create, and communicate information using digital technology and multiple online sources (Gilster, 2025).
Digital survival skills refer to the essential technological competencies needed to function in a digital environment, including troubleshooting, information access, and responsible technology use (Dy, 2022).
Instructional delivery and classroom management refer to the strategies teachers use to facilitate learning and maintain an organized, productive learning environment. In this study, this is one dimension of teachers' fulfillment.
Instructional leadership and supervisory support refer to the guidance, mentoring, monitoring, and assistance school leaders provide to improve instructional quality and teacher performance.
Instructional technology integration refers to the effective incorporation of digital tools and applications into teaching and learning to enhance educational outcomes (Aslan, 2020).
Learner engagement and achievement refer to the active participation, motivation, and academic performance of learners in the teaching-learning process. In this study, these serve as indicators of teachers' fulfillment.
Level of teachers' fulfillment refers to the degree of satisfaction, accomplishment, motivation, and professional well-being teachers experience in performing their roles.
Non-teaching personnel refers to school employees who perform administrative, clerical, technical, and support functions but are not directly involved in classroom instruction.
Online classroom management refers to the strategies teachers use to organize, monitor, and facilitate learning activities in virtual or technology-mediated environments (Bowden et al., 2021).
Problem-solving in digital contexts refers to the ability to identify, analyze, and resolve problems through the effective use of digital tools and resources (Mishra & Koehler, 2023).
Professional collaboration and administrative support refer to the cooperative efforts among school personnel and the assistance school leaders provide to promote effective teaching, professional growth, and organizational effectiveness.
Professional growth and accountability refer to the continuous improvement of teachers' competencies and their responsibility for meeting professional standards and educational goals.
Recognition, motivation, and well-being support refer to the practices and programs that acknowledge employee contributions, sustain motivation, and promote physical, emotional, and professional well-being.
School heads refer to the administrators responsible for managing school operations, supervising personnel, and
providing instructional leadership in public elementary schools.
Shared vision and goal alignment refer to the common understanding and commitment of school personnel toward the school's mission, vision, and objectives.
Suitability, acceptability, and feasibility refer to the criteria used to evaluate the proposed capacity development plan in terms of its appropriateness, stakeholder approval, and practicality of implementation.
Supervisors refer to education officials responsible for monitoring schools, providing technical assistance, and supporting the professional development of school heads and teachers.
Teachers refer to professional educators responsible for planning, delivering, assessing, and facilitating learning among learners in public elementary schools.
Teachers' fulfillment refers to the extent to which teachers experience satisfaction, motivation, accomplishment, and professional well-being in performing their educational responsibilities.
Use of educational platforms refers to the utilization of learning management systems, online applications, and digital platforms to support teaching, learning, communication, and administrative tasks (Republic of the Philippines, 2020).
Review Of Related Literature and Studies Local Literature
This section reviews Philippine policy issuances, curricular frameworks, and government reports that bear directly on digital aptitude, professional collaboration and administrative support, and teachers' fulfillment, situating the present study within the current national policy environment for public elementary education.
To begin, the MATATAG Curriculum Framework and Guide serves as a foundational component of elementary education reform in response to the rapidly changing socio-technological landscape. This framework mandates the integrated teaching of digital literacy, media evaluation, and technology-based problem-solving across all elementary grades. By introducing these competencies early, the curriculum seeks to build critical thinking skills and practical technological ability among young learners. It also provides guidelines for effective technology use that avoid information overload, balancing screen time with interactive teaching techniques. In practice,
the framework gives teachers a structured way to embed digital literacy within core subjects rather than treating it as a standalone topic, while requiring comprehensive training so that teachers can select age-appropriate digital content that promotes analytical thinking. Ultimately, this national strategy aims to give public schools an equitable means of integrating digital tools into learning, fostering a culture centered on media ethics, safety, and digital problem-solving (Department of Education, 2023).
In a related policy effort, the Department of Education and UNICEF Philippines (2022) issued the Alternative Learning System (ALS) 2.0 ICT Strategic Plan, a collaborative undertaking aimed at establishing technology-driven equity within non-traditional educational pathways. The plan lays out a multi-year framework for modernizing digital education management, enhancing educator skills, and ensuring secure online data management within flexible delivery systems. It gives particular attention to non-formal education structures, ensuring that marginalized, over-aged, or out-of-school learners are not left behind amid technological change. The
strategy also identifies funding sources and training programs to improve the digital readiness of mobile teachers and community coordinators, while addressing infrastructure gaps through recommendations for low-bandwidth tools and offline learning software suited to remote rural areas. By prioritizing data security and user privacy, the framework establishes a safe environment for monitoring student progress and managing digital records. Taken as a whole, the strategic plan seeks to bridge the digital divide by turning alternative learning into an adaptable, secure educational network.
At the legislative level, the Second Congressional Commission on Education, or EDCOM II (2026), released its Year
3 Report, an authoritative, data-driven assessment of the country's legislative and operational education frameworks. The report evaluates how well ICT systems are aligned across the public education sector and identifies significant policy barriers, proposing measures to address structural weaknesses in digital platforms and gaps in teacher capacity development that impede technological integration. Notably, it highlights an urgent need to align actual classroom conditions with the
ambitious digital competency goals set by central authorities, and it calls for specific legislative and budgetary measures to secure reliable internet access and standardized technical resources across school divisions. It further stresses the need to update human resource policies so that non-teaching staff receive proper training in managing school-based digital portals. In this way, the report offers guidance for aligning congressional funding with genuine school needs.
On the budgetary side, the Agency Budget Notes accompanying the Department of Education's Fiscal Year 2026 Budget provide an analytical overview of the financial dynamics underpinning national education reforms. Functioning as an institutional review, the notes track budget utilization and execution rates within the DepEd Computerization Program (DCP) across public elementary districts, examining fiscal efficiency and clarifying the link between fund allocation, procurement, and actual installation in schools. This analysis helps lawmakers identify bottlenecks in distribution chains that delay hardware delivery, particularly in remote divisions. The notes also emphasize that sustainable funding must extend to the
ongoing maintenance and technical support of deployed devices, linking financial accountability directly to educational outcomes and ensuring that public funds translate into greater student exposure to technology. In this sense, the budget notes serve as an important oversight instrument, helping public schools convert investment into functional, tech-equipped classrooms.
Turning to governance, DepEd Order No. 009, s. 2026 introduces structural changes to academic scheduling while embedding principles of inclusive governance into school administration. The order standardizes how academic calendars are set and requires school heads to establish consultative processes, clear communication channels, and shared planning committees, ensuring that major scheduling changes do not disrupt instructional effectiveness, teacher welfare, or student retention. It also requires the involvement of teachers, parent associations, and non-teaching personnel in adjustments to operational decisions, creating a participatory planning process rather than a top-down one. Dedicated time built into the updated calendars further supports regular peer
lesson preparation and cross-departmental alignment. Altogether, the order demonstrates that managing complex transitions successfully depends on open dialogue and collaborative decision-making.
In a similar governance vein, DepEd Memorandum No. 027, s. 2026 reframes routine school maintenance as a broader community engagement initiative built on collaborative governance. It mobilizes supervisors, school heads, teachers, and local stakeholders into joint action panels tasked with preparing learning environments ahead of the school year. The guideline sets out protocols for partnering with local government units, private businesses, and civic organizations to gather resources and improve infrastructure, with an emphasis on shared responsibility. School leaders are required to conduct transparent planning sessions that track contributions and volunteer efforts, helping address localized concerns and building safer, more resilient facilities while reinforcing trust between schools and their surrounding communities.
On matters of safety, DepEd Order No. 007, s. 2024 establishes protective frameworks for securing both the
physical boundaries and the digital systems of modernized school campuses, covering safety protocols, data tracking, and administrative procedures across districts. The order clarifies school leaders' accountability for supporting teachers and non-teaching staff by establishing secure campus perimeters, and it requires visible risk-mitigation and emergency-response plans alongside strict handling of sensitive student information to prevent network breaches. In doing so, it removes ambiguity around roles and responsibilities during crises and helps ensure an organized environment conducive to academic work. Ultimately, the order reminds school leaders that comprehensive support begins with safeguarding everyone involved, both physically and digitally. Looking further ahead, the Department of Education (2024), through DepEd Order No. 012, s. 2026, articulates a long-term vision for education quality standards over the next decade. This master plan strengthens compliance mechanisms and supervisory oversight nationwide, providing blueprints for institutional accountability and data-driven management, and it sets advanced criteria for measuring progress in
instructional innovation and cooperation. It also introduces incentive programs that recognize outstanding professionals who exceed baseline standards, promoting transparency through published achievements and annual reviews. In sum, the order establishes a framework for elevating the overall educational experience while reinforcing recognition and accountability.
On teacher welfare, the Department of Education (2025) issued a directive promoting workplace wellness and protecting teaching staff by establishing wellness intervals and mental health crisis interventions at the division level. The initiative aims to reduce stress and combat attrition, assigning clear accountabilities to supervisors and school heads for maintaining supportive environments. By highlighting the connection between fulfillment and emotional well-being, the directive strengthens engagement and outlines funding streams for rehabilitating faculty spaces, ultimately building formal structures that foster resilience, personal growth, and professional support within schools.
From a broader socioeconomic perspective, the National Economic Development Authority (2023) lays out a roadmap for
investment in human capital that includes strategies for elevating the dignity, mobility, and satisfaction of educators. This roadmap recognizes the need for compensation adjustments and structured career pathways that stabilize the quality of basic education. It also fosters collaboration among planners, administrators, and funding agencies, prioritizing upgrades and reduced workloads while valuing the retention of high-performing teachers. By establishing regional support facilities, the roadmap helps shield personnel from economic strain, treating satisfaction and retention as benchmarks of broader societal progress.
With respect to professional licensure, the Professional Regulation Commission (2024), through PRC Resolution No. 12,
s. 2024, updates the Continuous Professional Development Compliance Matrix for teachers. The resolution aligns licensing renewal requirements with current professional development needs, restructuring credit accumulation to emphasize meaningful research and community partnerships. By recognizing quality projects and easing compliance burdens, it makes professional development more personally meaningful,
offering affordable and even free training options that reduce the financial strain of accreditation. In balancing accountability with attainable growth, the resolution links credits to promotion opportunities across divisions, reinforcing continuous training as a practical tool for confidence-building and long-term career fulfillment.
Finally, the Department of Education (2026) introduced an evaluation manual that standardizes indicators for tracking educators' community engagement and instructional output. The manual provides systematic performance matrices tied to clear milestones, helping clarify expectations and reduce evaluation-related anxiety. Ensuring that metrics account for collaboration and community involvement recognizes partnerships while limiting evaluator bias. The manual also requires portfolios for verification, which helps identify areas for growth and celebrate accomplishments, transforming the evaluation cycle into a supportive process that strengthens professional competence and organizational accountability.
Foreign Literature
This section examines international and comparative
literature on digital competence, professional collaboration, administrative leadership, and teacher fulfillment, providing a broader conceptual backdrop against which the local findings of this study may be interpreted.
To begin, the European Commission (2022) sets out the core parameters of modern digital competence through its structured digital citizenship framework. This foundational document breaks technical capability down into clear behavioral indicators, including digital literacy, content creation, and cybersecurity awareness. In doing so, it demonstrates that technical mastery cannot exist apart from practical problem-solving in digital contexts and outlines how citizens and public workers alike must manage data systems safely to protect institutional integrity. Individuals who struggle to grasp these protocols tend to fall behind in increasingly virtual environments. Overall, this framework offers a useful conceptual blueprint for assessing basic workforce readiness in the digital era.
Building on this, UNESCO (2023) underscores the need to adapt digital competencies to modern educational disruptions.
Its international policy guidance holds that the rapid advance of artificial intelligence demands heightened digital ethics and responsibility from classroom instructors, and that emerging technologies call for flexible intellectual adaptability rather than fixed technical habits. It further notes that teachers must curate safe online spaces while maintaining robust data privacy controls. When educators fail to keep pace with shifting guidelines, instructional effectiveness declines; accordingly, UNESCO urges school divisions worldwide to update their training to protect classrooms from digital vulnerability.
Moving from policy to practice, Bates (2024) illustrates how teachers apply these competencies in managing modern online classrooms. His open-access text examines the balance between basic technology use and genuine instructional technology integration, arguing that successful use of educational platforms depends far more on an instructor's pedagogical intent than on the sophistication of the software itself. He explains that unstructured digital communication can confuse elementary learners without proper teacher guidance, and warns
that instructors must build practical troubleshooting skills to keep pace with digital change. Clear instructional design, he concludes, is what transforms ordinary digital tools into meaningful platforms for learning.
In a related theoretical contribution, Siemens (2021) argues that learning in a hyper-connected world is driven by a network of digital communication skills. His updated connectivist review examines how modern education systems process, preserve, and retrieve digital knowledge over time, holding that an individual's digital survival skills depend heavily on the ability to navigate complex, interconnected information channels. He further contends that traditional classroom boundaries dissolve once students and teachers interact through digital platforms, helping explain why data management and preservation have shifted from a clerical task to a core teaching requirement. Understanding how knowledge flows through such networks, he concludes, remains essential for evaluating modern educational environments.
Complementing this, the International Society for Technology in Education (2025) standardizes what educators
must possess to operate effectively in virtual classrooms, bridging the gap between basic digital literacy and active, real-time online classroom management. Its handbook requires teachers to maintain sharp cybersecurity awareness to protect sensitive student records, and argues that content creation and curation must be genuinely engaging to hold the attention of digital-native learners. School systems that align their capacity development plans with these global standards tend to show markedly higher technological proficiency, reinforcing the view that a teacher's digital aptitude directly shapes classroom effectiveness.
Shifting to the collaborative dimension, Hargreaves and O'Connor (2020) distinguish superficial teamwork from authentic professional collaboration in schools. Their theoretical work holds that genuine collaboration must be rooted in solidarity, collective responsibility, and mutual professional trust, cautioning that forced administrative meetings often produce contrived interactions that stall real progress. Instead, they argue, collaborative cultures require structured freedom and shared decision-making power to thrive;
when teachers feel genuinely connected to their peers, they are far more likely to share innovative strategies. Identifying the true markers of collaboration, the authors conclude, remains an essential task for school evaluators.
In agreement with this view, Fullan and Gallagher (2022) maintain that collaborative systems cannot function without intentional administrative support from school leadership. Their work argues that school heads must move beyond purely bureaucratic oversight to become active enablers of change, noting that administrators who prioritize removing logistical roadblocks markedly improve staff climate. This systemic support includes providing adequate resources, protecting planning time, and funding continuous capacity development. Teachers' willingness to experiment with technology, they show, is closely tied to the psychological safety their leaders provide—making leadership behavior the foundation for any major institutional change.
Extending this line of reasoning, Harris and Jones (2024) show how distributed leadership can merge administrative support with teacher teamwork. Their work examines how school
heads build high-performing professional learning communities by delegating authority, thereby lightening their own administrative burden while increasing staff investment. This shared responsibility helps make collaboration a daily habit rather than an imposed rule, and the authors find that schools with flexible administrative structures adapt more quickly to unexpected challenges—positioning distributed governance as a key mechanism for building resilient school systems.
Similarly, Leithwood (2021) categorizes administrative support into distinct, measurable behaviors that shape the school environment. His core text holds that effective school leaders must set clear organizational direction, develop personnel capability, and redesign institutional structures, and he finds that genuine interest in individual teacher development measurably raises staff morale. This kind of leader-led encouragement, he notes, helps ease the anxiety associated with adopting complex digital platforms in elementary schools. Because administrative support must be visible, consistent, and aligned with the school's long-term vision, his framework offers a practical tool for evaluating
supervisory performance.
At a broader scale, the OECD (2023) documents global patterns in how administrative infrastructure shapes daily teacher operations. Its comprehensive compendium analyzes the links between resource allocation, leadership behavior, and collaborative school culture, finding that divisions facing severe resource shortages rely especially heavily on strong administrative guidance to maintain stability. Teachers who receive consistent managerial recognition, the data show, report a stronger sense of professional community, while a breakdown in administrative support almost always triggers a corresponding collapse in teamwork. This global perspective underscores the critical role leadership plays in sustaining a healthy school culture.
Turning to teacher fulfillment specifically, Kelchtermans (2021) conceptualizes it as a deeply personal and emotional state tied to systemic validation, arguing that professional satisfaction extends well beyond salary or comfortable working hours. He holds that true fulfillment stems from an educator's sense of self-efficacy and professional vulnerability: when
teachers feel overwhelmed by digital demands without adequate training, fulfillment drops sharply, whereas institutional recognition of a teacher's achievements renews their dedication almost immediately. School divisions, he concludes, must treat fulfillment as a complex psychological variable requiring ongoing structural attention.
Expanding on this, Day (2022) traces the factors that sustain or erode long-term teacher commitment in public education. His volume explains that elementary teachers face distinctive emotional demands requiring considerable personal resilience, and notes that the sudden introduction of complex digital platforms can quickly lead to burnout if left unsupported. Fulfillment, he shows, is achieved when teachers perceive alignment between their personal values and institutional goals, with administrative support and collaborative peers acting as protective buffers against everyday workplace stress—making these emotional dynamics essential to any effective retention strategy.
From a motivational perspective, Ryan and Deci (2020) propose that human fulfillment rests on three basic
psychological needs: autonomy, competence, and relatedness, arguing that individuals thrive only when they feel capable in their roles and connected to their community. In an educational setting, digital competence satisfies teachers' need for professional competence, professional collaboration satisfies their need for relatedness, and administrative guarantees of autonomy raise satisfaction and overall well-being. This motivational theory offers a useful framework for linking digital skills and leadership support directly to teacher fulfillment.
In a closely related study, Evans (2023) finds that the internal conditions of a school division determine whether teachers experience genuine professional fulfillment. Her review identifies intellectual stimulation, clear pathways for advancement, and technological mastery as strong predictors of teacher happiness, showing that teachers display markedly higher fulfillment when they feel prepared for modern digital classrooms. She recommends that administrators manage fulfillment intentionally rather than treat it as an incidental byproduct of employment, demonstrating that targeted
institutional adjustments can systematically improve teacher morale.
Bringing these threads together, Acton and Glasgow (2024) argue that capacity development plans must be designed specifically to foster long-term teacher fulfillment. Their work examines how education systems can address career burnout by restructuring training frameworks, showing that clear, targeted training in digital survival skills replaces teacher anxiety with professional confidence. Paired with strong administrative backing, this confidence creates conditions favorable to long-term fulfillment, offering conceptual justification for structured capacity development plans in public school divisions.
Darling-Hammond et al. (2023) emphasize the transformative potential of professional learning sustained through self-directed agency and peer collaboration, finding that teachers who engage in reflective practice and collaborative innovation experience greater professional growth. Ongoing opportunities for feedback and dialogue, their review shows, meaningfully reduce burnout and enhance fulfillment; effective professional
development, they argue, must move beyond isolated workshops toward embedded, context-responsive learning communities. By fostering teacher agency, such communities build a sense of control that promotes resilience and sustained motivation, offering school leaders a roadmap for cultures of continuous improvement.
Harris and Jones (2024) also critique the limitations of isolated professional development events, arguing that piecemeal training rarely produces lasting institutional change unless connected with collaborative teamwork and well-being initiatives. They advocate for action plans that explicitly link technology upskilling, structured collaboration, and well-being support into cohesive systems, allowing schools to translate policy goals into everyday practice. Stakeholder feedback, they note, is essential for ensuring the relevance and acceptance of such models, which together address the common pitfalls of fragmented development approaches while balancing skill acquisition with social-emotional support.
At a systems level, the World Bank Group (2025) offers a
macro analysis of digital transformation in education, identifying persistent structural barriers to local implementation despite strong national directives. These include uneven distribution of fiber-optic infrastructure and outdated policy frameworks, which create bottlenecks even where teachers possess the willingness and aptitude to use digital tools. The report calls for policy reforms that align infrastructure investment, teacher training, and school-level support, and recommends collaboration among government, the private sector, and communities to build sustainable connectivity solutions—underscoring the complexity of achieving equitable digital transformation across education systems.
Aas and Brandmo (2023) examine how supportive administrative practices and cooperative staff structures contribute to teacher retention and organizational satisfaction, finding that shared vision, instructional leadership, and transparent communication together create a positive organizational climate. Such conditions, they argue, maximize teachers' sense of professional fulfillment and
efficacy. Drawing on survey data from multiple schools, their study highlights the direct relationship between leadership style and teacher well-being, stressing that investment in leadership development is key to sustainable human resource management—a conclusion consistent with the broader literature on the social and psychological dimensions of teaching.
Alastor et al. (2025) investigate how comprehensive digital transformation reduces disparities in technical skill across organizational levels, finding that systemic integration of digital tools and training distributes baseline digital proficiency more evenly among school heads, supervisors, teachers, and support staff. This harmonization promotes consistent competency in literacy, communication, and data management. Based on quantitative competence assessments and organizational surveys, the study suggests that well-planned digital initiatives can foster equitable growth opportunities regardless of role or hierarchy, reinforcing the case for holistic digital capacity-building that avoids widening existing disparities.
Blackmore and Harrison (2024) focus on the role of progress
monitoring and diagnostic assessment in sharpening teaching precision, showing that schools using diagnostic and longitudinal tracking tools significantly improve teachers' ability to identify learning barriers and address curriculum gaps. These approaches, they find, increase both instructional efficacy and institutional fulfillment by giving teachers actionable data to guide instruction. Drawing on case studies of systematically integrated formative assessment, the authors argue that embedding diagnostic tools into everyday practice supports responsive pedagogy and reveals a close relationship between assessment practice and teacher motivation.
Epstein et al. (2024) analyze how structured school-community partnerships and proactive parent-teacher alliances affect educators' sense of purpose and career longevity, finding that when staff help co-create outreach programs with external stakeholders, a robust social support network emerges for students and teachers alike. This network, their mixed-methods study shows, strengthens educators' sense of belonging and mission. Building such alliances, the authors note, requires intentional frameworks for collaboration and
resource-sharing beyond the classroom, arguing that community engagement should be a core component of teacher support systems.
Evans and Hargreaves (2023) advocate an integrated ecosystem perspective on sustainable teacher fulfillment, finding that satisfaction and efficacy depend more on continuous capacity building, formative feedback, and stakeholder engagement than on physical infrastructure alone. Using longitudinal data from multiple settings, they show that ongoing professional development and tools for monitoring student progress significantly strengthen teachers' sense of institutional purpose, with strong leadership and administrative support further fostering growth. Sustainable fulfillment, they conclude, requires a multifaceted approach that addresses the social, emotional, and professional needs of educators together.
García-Martínez et al. (2023) investigate how distributed leadership and internal communication networks shape organizational climate, finding that when administrative support and collaborative goals are embedded in school culture,
teachers, non-teaching staff, and supervisors tend to share aligned perceptions of leadership effectiveness. This alignment narrows perceptual gaps across roles and fosters a more cohesive work environment. Using mixed methods to assess climate, communication, and leadership practice, the authors conclude that distributed leadership promotes fairness, trust, and shared accountability, clarifying its impact on both decision-making and organizational morale.
Guillén-Gámez et al. (2024) examine advanced digital competence as a driver of teacher self-efficacy and job satisfaction, finding that mastery of digital platforms, online classroom management, and data analytics reduces work-related stress and boosts professional confidence. Digital aptitude, they argue, should be understood not merely as a technical skill but as a foundation for pedagogical confidence more broadly. Survey and observational data confirm a correlation between digital ease and elevated motivation, particularly when teachers face new instructional challenges, underscoring the value of rigorous digital skills training in both pre-service and ongoing professional development.
Marasigan and Sorbeto (2025) explore the relationship between student-centered instruction, resource support, and teacher job satisfaction, finding that access to diverse instructional resources and the autonomy to implement student-focused approaches significantly reduces burnout. Such classrooms, their study shows, are more engaging for students and more fulfilling for teachers, with comprehensive resource support underpinning effective teaching routines and sustained engagement. The authors call on school leaders to prioritize both materials and pedagogical freedom, alongside ongoing support systems that help teachers manage workload while innovating instruction.
By contrast, Nguyen and Ng (2024) examine the organizational stressors and resource constraints that hinder collaborative teamwork, finding that inadequate funding and resource allocation create a time-and-resource deficit for teachers balancing administrative tasks with core instructional roles. This bottleneck limits meaningful collective planning and lowers both morale and effectiveness. Drawing on survey data and case studies, the researchers argue
that without redesigning resource distribution and workload management, collaborative mandates will fail to translate into practice, and they recommend that policymakers align resources more strategically to support collaboration and reduce occupational stress.
Finally, Williamson and Thorne (2024) examine the effects of formative assessment and structured progress monitoring on classroom engagement and student outcomes, finding that continuous, targeted feedback creates a dynamic loop that enhances learning and participation. Teachers who systematically monitor student progress, they show, feel more effective and professionally fulfilled, as continuous assessment enables timely intervention for struggling students. The authors argue that formative assessment is a vital mechanism linking instructional practice to student needs and teacher motivation, underscoring the value of institutionalizing such strategies to boost both achievement and satisfaction.
Local Studies
This section reviews recent Philippine studies that examine
the digital, collaborative, and administrative dimensions of teaching in public elementary schools, offering empirical grounding closer to the local context of the present study.
To start, Dela Cruz et al. (2026), in their descriptive quantitative study titled “Digital Literacy and Student Engagement: Exploring the Relationship among Public School Educators in Nueva Ecija,” investigated the relationship between teachers' digital literacy and student engagement in selected elementary schools in Nueva Ecija. Surveying 96 active teachers, the researchers examined instructional factors such as the curation of digital resources and technology integration. Results showed that although teachers were adept at using widely accessible tools such as Microsoft Office, many struggled with more advanced instructional software essential to today's technology-oriented classrooms—pointing to a need for customized training that addresses these specific hurdles. Regression analysis further revealed a significant positive relationship between teachers' digital proficiency and students' motivation and resilience during lessons, indicating that stronger digital skills contribute to more engaging
learning environments. The study concludes that standardized training programs are needed to close these competency gaps and that strengthening teachers' digital literacy is foundational to building more interactive, learner-centered classrooms.
In a related study, Santos and Ramos (2025), in Digital Competency Application among Urban Public Elementary Teachers in Metro Manila, examined how 180 public elementary teachers in urban Metro Manila applied digital competencies using a descriptive-correlational design. The study focused on practical indicators such as technology integration and online classroom management. Findings showed that while teachers exhibited strong basic digital skills, significant gaps remained in advanced troubleshooting ability, underscoring an immediate need for organized ICT training that builds both confidence and capability. Effective online classroom management, the study found, depends heavily on teachers' familiarity with interactive software, yet many teachers faced limited access to curated resources that constrained their ability to deliver engaging lessons. The authors call on
education authorities to prioritize training that targets these specific competency gaps, thereby creating a more supportive online learning environment for both teachers and students.
Similarly, Aquino and Olabiyi (2025), in Evaluating Digital Literacy and Preparedness for MATATAG Curriculum Implementation among Primary Educators, examined digital literacy and preparedness among primary educators in relation to MATATAG Curriculum implementation. Results indicated that while these educators showed commendable digital literacy, particularly in the responsible use of technology, they faced systemic barriers such as limited access to resources and unreliable internet connectivity—exposing a disconnect between teachers' technological competence and the resources available to them. The study also found that success in integrating technology is closely tied to a teacher's self-efficacy, with confidence playing an integral role in effective tool use; regression analysis confirmed a correlation between digital literacy and readiness for curriculum implementation. The authors recommend continuous professional development tailored
to equipping teachers with the skills and resources needed to implement the MATATAG curriculum successfully.
Extending this line of inquiry, Valenzuela and Soriano (2025), in Ethical Practices in Digital Communication and Data Management among Public School Personnel, examined 165 public school personnel's understanding of ethical practices in digital communication and data management, with particular attention to secure record-keeping on online platforms. Findings showed that while teaching staff generally handled daily instructional responsibilities competently, non-teaching personnel often lacked essential skills in systematic data preservation—raising concerns about consistency in data management practices across institutions. The study calls for regular seminars on data security and ethics to reduce the risk of accidental breaches and reinforce ethical communication standards, arguing that cultivating a culture of ethical responsibility and data awareness among all staff strengthens operational efficiency and safeguards community trust.
In a complementary study, Aquino and Tolentino (2023), in Institutional Factors Influencing Educators' Adaptability and
Survival Skills in Digitized Settings, examined institutional factors shaping teachers' adaptability to new technologies and their digital survival skills across public elementary school districts. Surveying approximately 150 teaching professionals, the researchers evaluated daily workloads and access to technical equipment needed for technology integration. Results showed that administrative burdens linked to manual documentation hindered effective technology adoption, while teachers who participated actively in professional learning communities demonstrated better compliance with privacy regulations and stronger problem-solving skills in digital contexts. The study recommends continuous technical assistance and secure institutional frameworks to help teachers adapt smoothly to evolving digital demands, concluding that institutional support and systemic reform are essential to building resilient, adaptable school faculties.
Meanwhile, Castro and Mendoza (2024), in Teamwork Dynamics and Organizational Culture in Public Elementary Schools, used structural equation modeling to examine how teamwork dynamics shape organizational culture, surveying 310 supervisors and
faculty members with particular attention to peer discussion groups. The study found that effective administrative communication fosters cooperation among faculty and underscored leadership's central role in cultivating collaborative school climates. Where school leaders adopted participatory management styles that encouraged joint planning, teachers' willingness to collaborate across grade levels rose markedly, and shared goals emerged as a key factor in minimizing isolation among newcomers. The study concludes that cultures rooted in collaboration and shared vision unlock potential for innovation, ultimately improving student performance and reinforcing the importance of cohesive, motivated teaching communities.
By contrast, Villanueva and Corpuz (2026), in Instructional Leadership Supervisory Support and Communication Perceptions in Public Schools, examined perceptions of instructional leadership and supervisory support among fifteen supervisors, thirty school heads, and one hundred eighty teachers. The study found notable discrepancies in perceived communication efficiency, particularly in how feedback flows from classrooms
to administrative tiers: administrators generally viewed decision-making channels favorably, while teachers' accounts revealed misaligned perceptions that potentially obstruct collaboration. The authors stress the need for improved transparency and trust-building to reduce stress in demanding work contexts, arguing that closing these perceptual gaps is essential for fostering supportive environments that benefit both learners and teachers.
In a cross-national comparison, Maisyaroh et al. (2021), in Pedagogical Delivery Effectiveness through Collegial Supervision Models in Indonesia and the Philippines, examined techniques used to improve pedagogical delivery effectiveness in both countries, identifying twenty-six methods for enhancing material design at the local level. The study emphasized collegiality-driven models grounded in cultural norms and constructive reflection, finding that aligning objectives to elevate standardization efforts yielded tangible improvements in student performance. The findings support the need for structures that foster collaborative leadership and sustainable pathways for building educator competence, with
insights from both contexts showing that culturally responsive collegial supervision meaningfully contributes to teacher development and academic excellence.
Turning to retention, Bautista and Dimaculangan (2025), in Operational Variables Affecting Educator Satisfaction and Retention, examined the operational variables affecting satisfaction and retention among 240 educators, evaluating how leadership validation and recognition intersect with career trajectories. Findings showed that authentic acknowledgment nurtures long-term commitment to the profession and correlates with reduced attrition, supporting a balanced approach that aligns individual aspirations with departmental objectives. Administrative support, the study found, plays a crucial role in fostering fulfilling work environments; the authors conclude that enhancing motivation yields a high-caliber, dedicated teaching workforce and that sustained teacher fulfillment is vital to improving the quality of education.
Rounding out this group, Hernandez and Ferrer (2024), in Technological Aptitude and Multi-Stakeholder Collaboration in Luzon's Education Landscape, examined varying degrees of
technological aptitude across 200 respondents spanning supervisors, school heads, teachers, and non-teaching personnel in Luzon. The study found that teachers play a predominant role in creating localized instructional content adapted to district-specific needs, underscoring the importance of technical assistance and multifaceted collaboration among stakeholders to achieve productive workflows. The authors highlight the need for cohesive strategic initiatives that align policy compliance with the distinct roles of each stakeholder group, concluding that cross-sector dialogue is essential for advancing content creation and technological proficiency in Luzon's schools.
Turning to implementation planning, Bautista and Castro (2023) explored the role of contextualization in the successful implementation of school improvement plans in the Philippines, finding that local stakeholder acceptance depends heavily on how well strategic activities align with the cultural values and institutional context of each school division. Adopting generic improvement models, they argue, is insufficient; interventions must instead resonate with teachers,
supervisors, and administrators to build genuine buy-in. Through qualitative interviews and document analysis, the study found that flexibility in adapting plans to local needs significantly increases the likelihood of sustained implementation, offering a blueprint for designing intervention programs that are both effective and embraced at the school level.
Building on this, Mendoza (2024) conducted an action-research study on aligning school-level interventions with the Philippine Professional Standards for Teachers (PPST), finding that mapping school initiatives explicitly onto these national standards enhances both institutional suitability and stakeholder acceptance. Integrating technical upskilling with systemic capacity-building, the study found, was critical to ensuring the strategic feasibility and sustainability of improvement plans, and it cautions against fragmented, one-off training in favor of sustained development aligned with mandated competencies. When interventions are co-created with teachers and school heads, the study further found, they gain stronger legitimacy and foster a sense of ownership essential
to successful implementation.
Finally, Santos and Villanueva (2024) examined the operational feasibility of school-based action plans within Philippine educational ecosystems, pointing to the critical role of human capital readiness—particularly trained mentors and supportive administrative personnel—in facilitating effective implementation. Without adequate personnel capacity, they caution, even well-designed interventions risk failure or staff burnout. The study highlights the need for structured, transparent monitoring and evaluation systems to prevent administrative overload, finding that strategic fiscal and time planning must be realistically aligned with a school's existing resources to be sustainable, offering practical guidance for designing scalable, impactful action plans in resource-constrained settings.
Foreign Studies
This section presents international empirical studies on digital literacy, collaboration, administrative support, and teacher fulfillment, offering comparative evidence that situates the Philippine findings within a wider global context.
Primarily, Harrison and Fletcher (2026), in Digital literacy dynamics and instructional adaptation among elementary school educators, examined the relationship between foundational digital literacy and technology adaptation among 245 elementary teachers, evaluating indicators such as instructional technology integration, online classroom management, and digital content creation across diverse settings. Their findings showed that teachers with strong foundational technical skills demonstrated significantly lower resistance when adapting to advanced platforms, and regression analyses revealed that content curation ability improved considerably when schools provided ongoing access to open-source multimedia resources. The study highlights the role of effective online classroom management in boosting student engagement and calls for a shift from generic computer training toward targeted skill development aligned with everyday teaching practice.
In a related study, Al-Mansoor and Davies (2025), in Cybersecurity awareness, data survival skills, and technology adaptability in public basic education, examined predictors of
data survival competencies, cybersecurity awareness, and technology adaptability among 310 teachers, assessing how effectively educators uphold digital ethics while managing sensitive information on cloud platforms. Findings showed that administrative anxiety over complex data backup systems hampers smooth technology adaptation, though teachers who received continuous training in data management showed markedly better compliance with privacy standards. Moderation analysis confirmed a direct correlation between cybersecurity awareness and improved problem-solving during technical issues, leading the authors to conclude that fostering an adaptable teaching workforce requires reducing administrative burden while standardizing security measures across districts. Extending this focus, Tanaka and Sanderson (2024), in Problem-solving in digital contexts: Evaluating communication skills and platform usage across primary faculty tiers, investigated how 185 primary educators use digital communication skills and educational platforms to address pedagogical challenges. Results showed that while most educators adapt quickly to daily communication tools, significant gaps remain in long-term data
management, and that granting teachers’ autonomy to modify digital curricula correlates with greater willingness to experiment with new technology. The study frames platform proficiency as an evolving competency that depends on continuous exposure and structured peer feedback, concluding that genuine digital competence requires a balance of teacher agency, infrastructure support, and adherence to data security protocols.
Similarly, O'Connor and Jenkins (2025), in Predictors of technology adaptability and digital survival skills among early childhood educators, examined institutional and personal factors affecting the technology adaptability and digital survival skills of 220 early childhood educators. The analysis found that heavy administrative responsibilities often hindered the integration of interactive technologies, while teachers actively involved in professional learning communities showed markedly stronger ability to resolve digital challenges and evaluate media ethically. The study identifies teachers' technological coping strategies as protective buffers against frustration and instructional
fatigue, and it advocates reducing clerical demands on teachers to facilitate smoother adoption of new educational software. Turning to collaborative variables, Brooks and MacPhee (2026), in Shared vision, collegial planning, and teamwork mechanisms in elementary school governance, examined how institutional collaboration, communication frameworks, and shared goals shape organizational climate, drawing on data from 415 supervisors, administrators, and classroom practitioners. Structural equation modeling revealed strong correlations between effective communication and decision-making support from leaders and greater teacher cooperation and trust; when administrators adopted participatory approaches, teachers showedgreaterwillingnesstoengageincross-grade collaboration. The study concludes that unified institutional goals underpin all cooperative endeavors and that building effective school communities depends on transparent, two-way communication channels.
In a related structural study, Schneider and Vogel (2025), in the architecture of instructional leadership: Measuring supervisory support and communication pipelines in basic
education, examined how instructional leadership, supervisory support, and communication align across primary school divisions, compiling data from 30 supervisors, 45 school heads, and 260 teachers. The study found notable discrepancies in perception, with administrators rating administrative communication more favorably than teachers did; however, in schools where leaders prioritized collaborative planning and well-being checks, teachers reported greater professional trust and lower institutional stress. Instructional leadership proved most effective when paired with technical supervision and motivation strategies, underscoring the need for consistent communication systems to bridge perceptual gaps.
Complementing this, Henderson and Wallace (2024), in Recognition, motivation, and well-being support: A comparative study of administrative support styles, explored how different supervisory styles and recognition practices affect teacher motivation, team dynamics, and well-being, surveying 300 educators internationally. Findings showed that authentic validation and mental health provisions mattered more than resource allocation in fostering healthy work environments,
and regression analysis found that structured reward mechanisms combined with well-being support significantly reduced teachers' intent to leave the profession. Opportunities for professional growth also emerged as valued indicators of institutional investment, with regular recognition programs serving as a robust buffer against burnout.
Building on this, Guttman and Fischer (2025), in Communication and decision-making support as drivers of collective school efficacy, examined how institutional communication and decision-making support influence collective efficacy within primary education networks. The study found that standard administrative mechanisms were only moderately available and often fell short of high-level support standards, yet structural solutions such as shared planning committees and open consultation channels emerged as key predictors of instructional success. The authors conclude that sustainable improvement requires moving beyond basic infrastructure to actively integrate transparent decision-making into daily operations.
Turning to retention outcomes, Martinez-Ortiz and Keller (2026), in Determinants of teacher fulfillment and career retention in elementary education: The mediating role of administrative support, examined the operational variables affecting fulfillment, satisfaction, and retention across public school districts through a longitudinal survey of 450 educators. Findings indicated that authentic validation, career engagement, and mental health provisions mattered more than basic infrastructure, and regression analysis found that structured reward mechanisms and well-being programs lowered teachers' desire to leave the public system. A sense of fulfillment, the study found, was crucial for sustaining enthusiasm and teaching quality, pointing to the need for balanced strategies combining professional opportunity, administrative support, and stakeholder engagement.
In a related study on external support, Richter and Müller (2025), in Community engagement and stakeholder support as buffers against educator burnout and attrition, explored how community partnerships and parent-teacher associations influence teacher fulfillment and long-term commitment among
380 public school personnel. The study found that active local communities that support school facilities and student welfare programs foster a sense of achievement and connection among teachers, while also easing the administrative burden of daily operations. This finding demonstrates that strong community engagement enhances educators' social standing and emotional resilience, underscoring the importance of meaningful bonds among school leadership, faculty, and community members.
Relatedly, Campbell and Sterling (2024), in Unpacking professional growth and career engagement: What makes elementary school teachers feel fulfilled? examined the relationship between professional development opportunities and daily career engagement among 290 educators. Findings showed that authentic personal development mattered more than financial incentives in predicting long-term contentment, and that clear decision-making support and open communication from school heads correlated with higher satisfaction and lower turnover intent. Active engagement emerged as a critical factor in balancing clerical tasks with instruction, leading the authors to conclude that sustainable retention depends on
responsive, respectful collaborative environments.
Grounded in Self-Determination Theory, Nguyen and Laurent (2025), in Teacher achievement, satisfaction, and well-being among elementary school personnel: A psychological needs approach, examined how professional development, administrative structures, and resource distribution relate to multidimensional well-being and satisfaction among elementary school personnel. The study found that addressing baseline needs for autonomy and security lays the foundation for further professional growth and identified a strong connection between leadership support and job satisfaction, with greater resilience corresponding to lower burnout. Strategic investment in supervision, the authors conclude, stabilizes school systems and promotes inclusive, high-performing communities.
Examining multiple stakeholder perspectives, Carter and Sterling (2024), in Assessing technology usage and administrative workloads across four tiers of public-school stakeholders, examined digital competence and teamwork across 400 respondents spanning supervisors, school heads, teachers,
and non-teaching staff. The study found that classroom teachers remain the primary creators of localized content, while school heads supervise and curate materials for wider use and non-teaching staff provide essential technical support that preserves data integrity. Supervisors, the study found, tend to view digital aptitude through a policy compliance lens, while teachers focus on its day-to-day utility—leading the authors to conclude that digital aptitude functions as a shared competency requiring alignment between administrative and pedagogical priorities.
Similarly, Patterson and Douglas (2025), in Perceptions of governance leadership and well-being: A comparative multi-stakeholder analysis, examined perceptions of how administrative support affects collaborative performance among 300 teachers, 50 non-teaching staff, and 30 school heads. The study revealed clear variance in how stakeholders assess cooperation and support systems: supervisors linked collaborative alignment to goal-setting and recognition norms that foster positive climates, while non-teaching staff pointed to communication challenges that hinder workflow. The
authors call for policies that support institutional upskilling to help align changing roles within school operations.
Closing this comparative group, Kingsley and Harrington (2026), in Addressing challenges in digital life: multi-stakeholder perspectives on autonomy, growth, and satisfaction, examined overall satisfaction and fulfillment among public education stakeholders, evaluating how platform support systems and organizational solutions affect individual well-being. The study found that standard digital resources were only moderately available and often fell short of high operational support benchmarks, though solid organizational structures emerged as strong predictors of successful digital adoption. Autonomy played a key role in moderating the effect of self-care on the usefulness of institutional support, underscoring the need to move beyond basic infrastructure toward holistic mental health strategies and stakeholder collaboration.
Synthesis
This section draws together the threads of the preceding
review, showing how international frameworks, local policy, and empirical studies converge to support the theoretical and conceptual foundations of the present study.
Taken as a whole, international frameworks and local curricular policies delineate the core components of digital competence required in basic education, emphasizing structured, standards-driven workforce readiness across academic institutions (European Commission, 2022; UNESCO, 2023). Global standards recommend segmenting technical proficiency into behavioral indicators—foundational literacy, content creation, and cybersecurity awareness (European Commission, 2022; International Society for Technology in Education, 2025). Instructional design literature further stresses that the educational value of digital platforms depends on pedagogical intent rather than mere exposure to technology (Bates, 2024), while organizational studies show that digital survival depends on teachers' ability to navigate complex online ecosystems and manage institutional data responsibly (Siemens, 2021; International Society for Technology in Education, 2025). When teachers cannot develop
these specialized skills, their capacity to deliver balanced, interactive lessons diminishes accordingly (UNESCO, 2023). Collectively, these frameworks offer a conceptual roadmap for designing capacity development plans that raise workforce readiness in public schools (European Commission, 2022; International Society for Technology in Education, 2025).
Building on this, governance research shows that technical and curricular change demands a purposeful combination of administrative support and substantive professional collaboration (Fullan & Gallagher, 2022; Harris & Jones, 2024). Authentic collaboration, the literature emphasizes, surpasses token teamwork and must be rooted in mutual trust, shared planning, and collective responsibility (Brooks & MacPhee, 2026; Hargreaves & O'Connor, 2020). Sustaining professional learning communities requires leadership to shift from bureaucratic control toward actively removing logistical barriers and offering visible validation (Fullan & Gallagher, 2022; Henderson & Wallace, 2024), while distributed leadership models show that delegating authority to capable teachers enhances staff investment and reduces organizational friction
(Harris & Jones, 2024). Conversely, failures in supervisory support or communication typically precede declines in collegial planning and instructional adaptability (OECD, 2023; Schneider & Vogel, 2025). Resilient public-school systems, therefore, depend on administrators' deliberate cultivation of safe, collaborative workplace environments (Fullan & Gallagher, 2022; Leithwood, 2021).
Finally, psychological and organizational theories together assert that long-term commitment and teacher fulfillment arise from intentional institutional conditions rather than chance (Day, 2022; Evans, 2023). Motivation theory holds that fulfillment occurs when environments meet the core needs for autonomy, competence, and relatedness (Nguyen & Laurent, 2025; Ryan & Deci, 2020); in elementary settings specifically, digital competence satisfies the need for professional competence, collaboration satisfies the need for relatedness, and administrative guarantees of autonomy raise both satisfaction and well-being. Operational studies further document how sudden technical demands and heavy administrative workloads precipitate burnout in the absence of adequate
support (Campbell & Sterling, 2024; Day, 2022), while divisions that publicly recognize instructional accomplishment and offer clear pathways to technological mastery see reduced teacher anxiety and greater career satisfaction (Evans, 2023; Martinez-Ortiz & Keller, 2026). Taken together, these findings indicate that strategic investment through structured capacity development plans is a primary catalyst for stabilizing retention and cultivating sustained professional fulfillment (Acton & Glasgow, 2024).
Methodology
Research Design
This study determined the digital aptitudes, professional collaboration and administrative support, and teachers' fulfillment in public elementary schools within the Division of Pasig City, providing a data-driven basis for a proposed capacity development plan. To achieve this objective, the study employed a quantitative descriptive research design to systematically map out the current operational conditions and technology-driven realities among the institutional stakeholders.
In support of this design, Creswell (2021) asserts that descriptive research is particularly suitable when the primary objective is to accurately represent the authentic characteristics, behaviors, and perceptions of individuals, groups, or situations as they naturally exist. This methodology concentrates on outlining, analyzing, and interpreting the prevailing status of educational phenomena based directly on the firsthand experiences of participants. By employing
quantitative techniques such as surveys and structured questionnaires, it allows for the precise measurement of complex attitudes, evaluations, and institutional trends. It also allows the researcher to summarize large datasets through statistical frequencies, mean scores, and comparative analyses without altering existing field conditions. Because it emphasizes objective data collection, the design provides an empirical way to translate subjective human opinions into clear, actionable statistical data, ensuring that the resulting findings remain verifiable, structured, and free from researcher bias.
This descriptive research design was appropriate for the present study because it enabled the simultaneous quantification and comparison of assessments across four distinct respondent groups: supervisors, school heads, teachers, and non-teaching personnel. Given that the statement of the problem required an assessment of twelve digital sub-indicators alongside professional collaboration and administrative support metrics, a descriptive survey was the most efficient tool for mapping these multi-layered variables.
This approach allowed the researcher to identify specific gaps between policy expectations, such as the MATATAG curriculum mandates, and actual classroom practices, without disrupting daily school operations. The design also provided the statistical tools needed to run comparative analyses among respondent groups, highlighting areas where administrative perceptions might differ from classroom realities. By organizing the collected data into comprehensive frequencies and mean scores, the study was able to identify which schools or personnel groups required more urgent intervention. Ultimately, this descriptive framework ensured that the resulting capacity development plan was directly informed by the documented needs and operational profile of the Division. Population and Sampling
The population of this study comprised one thousand five hundred nine (1,509) active academic stakeholders across fifteen (15) public elementary schools in the Division of Pasig City, from which a representative sample of four hundred fifty-three (453) respondents was drawn.
These selected public elementary schools were as follows:
Pasig Elementary School, Palatiw Elementary School, Manggahan Elementary School, Liberato Damian Elementary School, Nagpayong Elementary School, Bambang Elementary School, Buting Elementary School, Kalawaan Elementary School, San Joaquin Elementary School, Bagong Ilog Elementary School, Caniogan Elementary School, Napico Elementary School, Maybunga Elementary School, San Lorenzo Ruiz Elementary School, and Santo Niño Elementary School.
To ensure a comprehensive diagnostic assessment, the selected sample was broken down into eight (8) district supervisors, fifteen (15) school heads, four hundred twelve
(412) teachers, and eighteen (18) non-teaching personnel.
These respondent groups were engaged in distinct professional capacities, including instructional delivery, school administration, and institutional support services. Collecting data from this entire configuration ensured that every level of school governance was represented in the study. Establishing this population baseline was essential for capturing an authentic snapshot of the Division's administrative and technological needs.
In choosing the sampling method, Etikan (2021) explains that purposive sampling is a non-probability technique in which researchers deliberately select respondents who possess significant knowledge, experience, and direct relevance to the phenomenon under study. This selection approach prioritizes operational depth over randomized statistical probability by targeting individuals who live the daily realities of the academic environment. By focusing on specific, information-rich groups, the technique allows researchers to gather detailed data that answers highly specialized research questions, while ensuring that chosen participants meet precise criteria linked to institutional role, administrative rank, or classroom experience. Because it relies on deliberate rather than random selection, the method helps guard against outliers or unqualified respondents skewing the collected data, thereby maximizing the utility of the data gathered within a structured organizational system.
Purposive sampling was appropriate for the present study because it targeted the specific groups responsible for executing the MATATAG curriculum mandates and managing digital
platforms across the Division. Given that the statement of the problem required an informed assessment across twelve digital sub-indicators, random sampling from the larger population of 1,509 risked inadvertently including staff with limited exposure to these systems, which could have diluted the practical value of the findings. Purposive sampling instead ensured that only the 453 supervisors, school heads, teachers, and non-teaching personnel who directly handled Division technology were evaluated, allowing the researcher to gather data that reflected genuine professional collaboration and administrative realities without straining institutional resources. By focusing on these 453 key stakeholders, the comparative analyses between administrative policy and classroom conditions became both statistically meaningful and operationally grounded, ensuring that the resulting capacity development plan was built upon authentic, expert assessment from the field.
| Name of School | Supervisors | School Heads | Teachers | Non-Teaching Personnels | Total | ||||||||||
| N | n | % | N | n | % | N | N | % | N | n | % | N | n | % | |
| BagongIlog Elementary School | 1 | `1 | 100 | 1 | 1 | 100 | 49 | 14 | 29 | 2 | 1 | 50 | 53 | 17 | 32 |
| Bambang Elementary School | 1 | 1 | 100 | 1 | 1 | 100 | 50 | 14 | 28 | 1 | 1 | 100 | 53 | 17 | 32 |
| Caniogan Elementary School | 1 | 1 | 100 | 1 | 1 | 100 | 59 | 17 | 29 | 2 | 1 | 50 | 63 | 20 | 32 |
| DeCastro Elementary School | 1 | 1 | 100 | 1 | 1 | 100 | 125 | 35 | 28 | 1 | 1 | 100 | 128 | 38 | 30 |
| Ilugin Elementary School | 1 | - | - | 1 | 1 | 100 | 100 | 25 | 25 | 1 | 1 | 100 | 103 | 27 | 26 |
| Kalawaan Elementary School | 1 | - | - | 1 | 1 | 100 | 87 | 28 | 32 | 1 | 1 | 100 | 90 | 30 | 33 |
| LiberatoDamian Elementary School | 1 | - | - | 1 | 1 | 100 | 54 | 25 | 46 | 1 | 1 | 100 | 57 | 27 | 47 |
| Manggahan Elementary School | 1 | - | - | 1 | 1 | 100 | 108 | 31 | 29 | 2 | 1 | 50 | 112 | 33 | 29 |
| Maybunga Elementary School | 1 | 1 | 100 | 1 | 1 | 100 | 75 | 21 | 28 | 1 | 1 | 100 | 78 | 24 | 31 |
| Nagpayong Elementary School | 1 | - | - | 1 | 1 | 100 | 300 | 75 | 25 | 1 | 1 | 100 | 303 | 77 | 25 |
| Palatiw Elementary School | 1 | - | - | 1 | 1 | 100 | 85 | 24 | 28 | 1 | 1 | 100 | 88 | 26 | 30 |
| PasigElementary School | 1 | 1 | 100 | 1 | 1 | 100 | 132 | 37 | 28 | 2 | 1 | 50 | 136 | 40 | 29 |
| Pinagbuhatan Elementary School | 1 | - | - | 1 | 1 | 100 | 108 | 31 | 29 | 2 | 2 | 100 | 112 | 33 | 29 |
| SagadElementary School | 1 | 1 | 100 | 1 | 1 | 100 | 29 | 8 | 28 | 2 | 2 | 100 | 33 | 12 | 36 |
| SanMiguel Elementary School | 1 | 1 | 100 | 1 | 1 | 100 | 96 | 27 | 28 | 2 | 2 | 100 | 100 | 31 | 31 |
| Total | 15 | 8 | 53.33 | 15 | 15 | 100.00 | 1457 | 412 | 28.28 | 22 | 18 | 100.00 | 1509 | 453 | 100.00 |
Table 1 presents the population and sample distribution of respondents by group and by school. In terms of the overall population, teachers obtained the highest number with 1,457, or 96.55 percent of the total population, followed by non-teaching personnel with 22, or 1.46 percent, while supervisors and school heads each accounted for 15, or 0.99 percent.
In the sample distribution, teachers likewise comprised
the largest group with 412 respondents, or 90.95 percent of the total sample, followed by non-teaching personnel with 18, or 3.97 percent; school heads with 15, or 3.31 percent; and supervisors with 8, or 1.77 percent. This indicates that teachers constituted the dominant group of respondents in the study, consistent with their representing the largest workforce among the selected schools.
By school, Nagpayong Elementary School obtained the highest total population, with 303 respondents and a sample of 77, followed by Pasig Elementary School with 136 respondents and a sample of 40, and De Castro Elementary School with 128 respondents and a sample of 38. Manggahan Elementary School and Pinagbuhatan Elementary School both followed next, with a population of 112 and a sample of 33 each. On the other hand, the schools with the lowest total population were Sagad Elementary School, with 33 respondents and a sample of 12; Bagong Ilog Elementary School and Bambang Elementary School, with 53 respondents and a sample of 17 each; and Liberato Damian Elementary School, with 57 respondents and a sample of 27.
This indicates that the sample was allocated proportionately to the population size of each school, ensuring adequate representation of respondents across the Division.
Respondents of the Study
The respondents of the study consisted of a diverse group of 453 personnel from public elementary schools in the Division of Pasig City, comprising teachers, school heads, supervisors, and non-teaching staff. They represented a wide range of ages, sex, civil status, educational attainment, and years of service.
| Respondent | F | % |
| Supervisors | 8 | 1.77 |
| School Heads | 15 | 3.31 |
| Teachers | 412 | 90.95 |
| Non-Teaching Personnel | 18 | 3.97 |
| Total | 453 | 100.00 |
Table 2 identifies the respondents of the study. Of the four hundred fifty-three total respondents, 412, or 90.95 percent, were teachers; 18, or 3.97 percent, were non-teaching personnel; 15, or 3.31 percent, were school heads; and 8, or
1.77 percent, were supervisors.
This distribution shows that teachers comprised the
majority of respondents, indicating that the study primarily captured the perspectives and experiences of classroom practitioners in public elementary schools in the Division of Pasig City. This strengthens the relevance of the study in examining teachers' digital aptitudes, professional collaboration, administrative support, and level of fulfillment, since teachers are the direct recipients and implementers of educational programs and school initiatives. The inclusion of supervisors, school heads, and non-teaching personnel further contributed supplementary administrative and operational viewpoints, providing a more comprehensive assessment of the variables under study.
| Age (in years) | Supervisors | School Heads | Teachers | Non-Teaching Personnels | Total | |||||
| f | % | f | % | f | % | f | % | f | % | |
| 51 years old and above | 4 | 50.00 | 8 | 53.33 | 91 | 13.54 | 4 | 9.76 | 107 | 14.54 |
| 46 – 50 years old | 2 | 25.00 | 2 | 13.33 | 57 | 8.48 | 1 | 2.44 | 62 | 8.42 |
| 41 – 45 years old | 2 | 25.00 | 5 | 33.33 | 78 | 11.61 | 1 | 2.44 | 86 | 11.68 |
| 36 – 40 years old | 54 | 8.04 | 1 | 2.44 | 55 | 7.47 | ||||
| 31 – 35 years old | 82 | 12.20 | 6 | 14.63 | 88 | 11.96 | ||||
| 26 – 30 years old | 50 | 7.44 | 5 | 12.20 | 55 | 7.47 | ||||
| Total | 8 | 100.00 | 15 | 100.00 | 412 | 100.00 | 18 | 100.00 | 453 | 100.00 |
Table 3 shows the distribution of respondents by age. Of
the total, 107, or 14.54 percent, were 51 years old and above; 88, or 11.96 percent, were 31 to 35 years old; 86, or 11.68
percent, were 41 to 45 years old; 62, or 8.42 percent, were 46
to 50 years old; and 55, or 7.47 percent, were 26 to 30 years old, matching the same count and percentage recorded for the 36-to-40 age bracket.
This age distribution suggests that the study gathered perspectives from individuals across different age groups, providing varied insights into teachers' digital aptitudes, professional collaboration, administrative support, and level of fulfillment in public elementary schools in the Division of Pasig City. The presence of both younger and older respondents further supports a more comprehensive understanding of how age and professional experience may shape perceptions and practices related to the variables under investigation.
| Sex | Supervisors | School Heads | Teachers | Non-Teaching Personnels | Total | |||||
| f | % | f | % | f | % | f | % | f | % | |
| Male | 3 | 37.50 | 6 | 40.00 | 163 | 24.26 | 5 | 12.20 | 177 | 24.05 |
| Female | 5 | 62.50 | 9 | 60.00 | 249 | 37.05 | 13 | 31.71 | 276 | 37.50 |
| Total | 8 | 100.00 | 15 | 100.00 | 412 | 100.00 | 18 | 100.00 | 453 | 100.00 |
Table 4 shows the distribution of respondents by sex. Of the total, 276, or 37.50 percent, were female, and 177, or
24.05 percent, were male.
This sex distribution shows that the study incorporated perspectives from supervisors, school heads, teachers, and non-teaching personnel of both sexes, allowing for a more inclusive assessment of the variables under investigation. The representation of male and female respondents across the different groups contributed to a broader understanding of how sex may relate to digital aptitudes, professional collaboration, administrative support, and level of fulfillment in public elementary schools in the Division of Pasig City, further strengthening the comprehensiveness and credibility of the study's findings.
| Civil Status | Supervisors | School Heads | Teachers | Non-Teaching Personnels | Total | |||||
| f | % | f | % | f | % | f | % | f | % | |
| Single | 143 | 34.71 | 7 | 38.89 | 150 | 33.11 | ||||
| Married | 8 | 100.00 | 15 | 100.00 | 267 | 64.81 | 11 | 61.11 | 301 | 66.45 |
| Widow/ed | 2 | 0.49 | 2 | 0.44 | ||||||
| Total | 8 | 100.00 | 15 | 100.00 | 412 | 100.00 | 18 | 100.00 | 453 | 100.00 |
Table 5 shows the distribution of respondents by civil status. Of the total, 301, or 66.45 percent, were married; 150, or 33.11 percent, were single; and 2, or 0.44 percent, were widowed.
This civil status distribution shows that the study included supervisors, school heads, teachers, and non-teaching personnel with varying marital statuses, providing diverse perspectives on the variables under investigation. The participation of single, married, and widowed respondents contributed to a more comprehensive understanding of how personal and family responsibilities may relate to digital aptitudes, professional collaboration, administrative support, and level of fulfillment in public elementary schools in the Division of Pasig City.
| Educational Attainment | Supervisors | School Heads | Teachers | Non-Teaching Personnels | Total | |||||
| f | % | f | % | f | % | f | % | f | % | |
| Doctorate Degree | 5 | 62.50 | 9 | 60.00 | 27 | 6.55 | 41 | 9.05 | ||
| Doctorate with earned units | 3 | 37.50 | 4 | 26.67 | 15 | 3.64 | 22 | 4.86 | ||
| Master’s Degree | 2 | 13.33 | 88 | 21.36 | 90 | 19.87 | ||||
| Masterswith earned units | 69 | 16.75 | 69 | 15.23 | ||||||
| Bachelor’s Degree | 213 | 51.70 | 18 | 100.00 | 231 | 50.99 | ||||
| Total | 8 | 100.00 | 15 | 100.00 | 412 | 100.00 | 18 | 100.00 | 453 | 100.00 |
Table 6 shows the distribution of respondents by educational attainment. Of the total, 231, or 50.99 percent, held a bachelor's degree; 90, or 19.87 percent, held a master's degree; 69, or 15.23 percent, had earned units toward a
master's degree; 41, or 9.05 percent, held a doctorate degree; and 22, or 4.86 percent, had earned units toward a doctorate. This distribution highlights that supervisors, school heads, teachers, and non-teaching personnel possessed varying levels of academic qualification, contributing diverse perspectives on the variables examined in the study. The presence of respondents holding bachelor's, master's, and doctoral degrees suggests that professional knowledge and academicpreparationmayinfluencedigitalaptitudes, professional collaboration, administrative support, and level of fulfillment in public elementary schools in the Division of Pasig City, further strengthening the depth and credibility of
the study's findings.
| Number of Years in Service | Supervisors | School Heads | Teachers | Non-Teaching Personnels | Total | |||||
| f | % | f | % | f | % | f | % | f | % | |
| 31yearsand above | 1 | 12.50 | 3 | 20.00 | 7 | 1.04 | 11 | 1.49 | ||
| 26 – 30 years | 3 | 37.50 | 4 | 26.67 | 14 | 2.08 | 1 | 2.44 | 22 | 2.99 |
| 21 – 25 years | 2 | 25.00 | 3 | 20.00 | 27 | 4.02 | 1 | 2.44 | 33 | 4.48 |
| 16 - 20 years | 2 | 25.00 | 5 | 33.33 | 30 | 4.46 | 2 | 4.88 | 39 | 5.30 |
| 11 – 15 years | 77 | 11.46 | 3 | 7.32 | 80 | 10.87 | ||||
| 6 – 10 years | 123 | 18.30 | 6 | 14.63 | 129 | 17.53 | ||||
| 5yearsand below | 134 | 19.94 | 5 | 12.20 | 139 | 18.89 | ||||
| Total | 8 | 100.00 | 15 | 100.00 | 412 | 100.00 | 18 | 100.00 | 453 | 100.00 |
Table 7 shows the distribution of respondents by number of
years in service. Of the total, 139, or 18.89 percent, had 5 years and below in service; 129, or 17.53 percent, had 6 to 10
years; 80, or 10.87 percent, had 11 to 15 years; 39, or 5.30
percent, had 16 to 20 years; 33, or 4.48 percent, had 21 to 25
years; 22, or 2.99 percent, had 26 to 30 years; and 11, or
1.49 percent, had 31 years and above in service.
This distribution shows that the study drew on the perspectives of both newly hired and long-serving personnel, allowing the findings to reflect how tenure and accumulated professional experience may shape digital aptitudes, professional collaboration, administrative support, and teachers' fulfillment across different career stages in the Division of Pasig City.
Research Instrument
The research instrument utilized in this study was a researcher-made survey questionnaire designed specifically to collect relevant data aligned with the study’s objectives. The questionnaire was developed based on the statement of the problems and underwent a rigorous validation process.
After the initial draft was completed, it was submitted to
evaluators including the program chair, panelists, and external experts from the Department of Education for assessment of its validity and format. Following the evaluators’ recommendations and in coordination with the adviser, the researcher revised the instrument accordingly. The final version was then approved by the adviser before it was administered.
The questionnaire consisted of six parts:
Part I. Profile of the Respondents. This part collected data on age, sex, civil status, educational attainment, and number of years in service.
Part II. Assessment of Digital Aptitudes in Public Elementary Schools in the Division of Pasig City. This part collected data on digital literacy, instructional technology integration, online classroom management, content creation and curation, cybersecurity awareness, digital communication skills, use of educational platforms, problem-solving in digital contexts, adaptability to emerging technologies, digital ethics and responsibility, data management preservation, and digital survival skills.
Part III. Assessment of Professional Collaboration and Administrative Support. This part generated data on shared vision and goal alignment, collaborative planning and teamwork, instructional leadership and supervisory support, communication and decision-making support, and recognition, motivation, and well-being support, using different criteria. Part IV. Assessment of the Level of Teachers' Fulfillment.
This part generated data on instructional delivery and classroom management, learner engagement and achievement, assessment and feedback practices, professional growth and accountability, and community and stakeholder involvement.
Part V. Assessment of the Challenges Encountered by the Respondents Relative to Digital Aptitudes, Professional Collaboration, and Administrative Support. This section aimed to identify and analyze the specific challenges respondents encounter concerning their digital competencies, collaborative efforts, and the administrative support available to them.
Part VI. Suitability, Acceptability, and Feasibility of the Proposed Capacity Development Plan. This final part assessed the proposed capacity development plan's overall
suitability, acceptability, and feasibility within the context of the respondents' needs and the school's operational framework.
Data Gathering Procedures
The following tasks were undertaken by the researcher in the conduct of the study:
-
Approval was sought from the selected schools to secure proper authorization and institutional support for the study.
-
The survey questionnaire was distributed to the identified respondent groups—supervisors, school heads, teachers, and non-teaching personnel—of the selected public elementary schools.
-
The completed survey questionnaires were retrieved from the respondents within the prescribed timeframe to ensure a satisfactory response rate.
-
The collected data were systematically tabulated and analyzed using appropriate statistical tools, with the assistance of a statistician, to generate meaningful results.
-
The findings were presented in both textual and tabular form.
Statistical Treatment of Data
The following statistical tools were used in the interpretation of the results according to the sub-problems:
-
Percentage. This was used to represent parts of a whole in relation to the total, where 100 percent represents the entire quantity (Bogenschutz et al., 2022). It was used to establish the profile of the respondents in terms of age, sex, civil status, educational attainment, and number of years in service.
-
Weighted Mean. This was used to determine the responses selected from the options on the Likert scale (Belicina, 2018). It was used to answer sub-problems no. 1, 2, 4, 6, and 8.
Formula
_∑fx
X =
N
where:
𝑥= Weighted mean
∑ = Summation of frequency fx = Weighted score
N = Number of cases
Interpretations of the computed means using the five-point
Likert scale were adopted as follows:
Digital Aptitudes and Professional Collaboration and Administrative Support in Public Elementary Schools in the Division of Pasig City
Option RangeVerbal InterpretationSymbol
| 5 | 4.20 | – | 5.00 | Highly Evident | HE |
| 4 | 3.40 | – | 4.19 | Evident | E |
| 3 | 2.60 | – | 3.39 | Moderately Evident | ME |
| 2 | 1.80 | – | 2.59 | Least Evident | LE |
| 1 | 1.00 | – | 1.79 | Not Evident | NE |
Level of Teachers’ Fulfillment Digital Aptitudes and Professional Collaboration and Administrative Support in Public Elementary Schools in the Division of Pasig City
| Option | Range | Verbal Interpretation | Symbol | |
| 5 | 4.20 | – 5.00 | Highly Fulfilled | HF |
| 4 | 3.40 | – 4.19 | Fulfilled | F |
| 3 | 2.60 | – 3.39 | Moderately Fulfilled | MF |
| 2 | 1.80 | – 2.59 | Least Fulfilled | LF |
| 1 | 1.00 | – 1.79 | Not Fulfilled | NF |
Challenges Encountered by the Respondents Relative to the Digital Aptitudes, Professional Collaboration and Administrative Support
| Option | Range | Verbal Interpretation | Symbol | |
| 5 | 4.20 | – 5.00 | Highly Encountered | HE |
| 4 | 3.40 | – 4.19 | Encountered | E |
| 3 | 2.60 | – 3.39 | Moderately Encountered | ME |
| 2 | 1.80 | – 2.59 | Least Encountered | LE |
| 1 | 1.00 | – 1.79 | Not Encountered | NE |
Suitability of the Proposed Capacity Development Plan Option Range Verbal Interpretation Symbol
| 5 | 4.20 | – | 5.00 | Highly Suitable | HS |
| 4 | 3.40 | – | 4.19 | Suitable | S |
| 3 | 2.60 | – | 3.39 | Moderately Suitable | MS |
| 2 | 1.80 | – | 2.59 | Least Suitable | LS |
| 1 | 1.00 | – | 1.79 | Very Least Suitable | VLS |
Acceptability of the Proposed Capacity Development Plan Option Range Verbal Interpretation Symbol
54.20 – 5.00Highly AcceptableHA
43.40 – 4.19AcceptableA
| 3 | 2.60 | – | 3.39 | Moderately Acceptable | MA |
| 2 | 1.80 | – | 2.59 | Least Acceptable | LA |
| 1 | 1.00 | – | 1.79 | Very Least Acceptable | VLA |
Feasibility of the Proposed Capacity Development Plan Option RangeVerbal Interpretation Symbol
| 5 | 4.20 | – | 5.00 | Highly Feasible | HF |
| 4 | 3.40 | – | 4.19 | Feasible | F |
| 3 | 2.60 | – | 3.39 | Moderately Feasible | MF |
| 2 | 1.80 | – | 2.59 | Least Feasible | LF |
| 1 | 1.00 | – | 1.79 | Not Feasible | VLF |
-
Analysis of Variance (ANOVA). Analysis of Variance (ANOVA). This statistical method was used to compare the means of three or more groups to determine whether statistically significant differences exist among them (Bian et al., 2022). It was used to answer sub-problem no. 3.
Formula
Where:
F MSbetween
MSwithin
MSbetween = Mean Square between columns MS within = Mean Square within columns
-
Pearson-Product Moment Correlation Coefficient. This statistical indicator measures the strength and direction of the linear relationship between two continuous variables, with values ranging from -1 to +1 (Holmes et al., 2023). This was used to answer sub-problem no. 5.
Formula:
Where:
r - correlation coefficient
xi - values of the x-variable in a sample x - mean of the values of the x-variable yi - values of the y-variable in a sample y - mean of the values of the y-variable
The critical t-value at the five percent (0.05) level of significance, with the corresponding degrees of freedom, was used to establish the region of acceptance and rejection in the study.
On the correlation coefficient and its interpretation (Papageorgiou, 2022):
| Range | Verbal Interpretation | Symbol | ||
| 1.00 | Perfect Correlation | PC | ||
| 0.71 | – | 0.99 | Very High Correlation | VHC |
| 0.51 | – | 0.70 | High Correlation | HC |
| 0.31 | – | 0.50 | Moderate Correlation | MC |
| 0.11 | – | 0.30 | Low Correlation | LC |
| 0.01 | – | 0.10 | Negligible Correlation | NC |
-
t-test for significance of the coefficient of correlation. Its t-test for the Significance of the Coefficient of Correlation. This test evaluates whether the observed correlation (r) between two variables in a sample reflects a true correlation in the population or occurred by chance. It tests the null hypothesis (H₀: ρ = 0), which states that there is no linear relationship between the variables (Papageorgiou, 2022).
Formula:
where:
r= correlation between two variables N= number of samples
Presentation, Analysis, and Interpretation of DataDigital Literacy
Sub-problem No. 1. How do the supervisors, school heads, teachers, and non-teaching personnel assess the Digital Aptitudes in Public Elementary Schools in the Division of Pasig City in terms of:
Table 7 reveals that respondents assessed digital literacy in public elementary schools as Highly Evident overall, earning a composite weighted mean of 4.39. Nine of the ten indicators were rated Highly Evident. The ability to operate computers, tablets, and other digital devices for classroom and office tasks and proficiency in using productivity software such as MS Office or Google Workspace for lesson preparation and reporting tied for first place, each earning a composite weighted mean of 4.57. Skill in managing email, calendars, and school communication platforms followed in third place at 4.46, ahead of the capability to follow digital instructions from manuals, tutorials, or online guides independently, which ranked fourth at 4.44. Commitment to upgrading digital knowledge through training or self-learning ranked fifth at
4.42, followed by the ability to organize, label, and store digital files systematically in sixth place at 4.40. Skill in performing advanced internet searches for curriculum-related resources ranked seventh at 4.35, just ahead of the capability to evaluate online sources for credibility and relevance, which placed eighth at 4.34. Understanding of fundamental digital concepts such as cloud storage, cybersecurity, and software updates rounded out the Highly Evident indicators in ninth place at 4.24. The lone indicator rated merely Evident was the ability to troubleshoot minor hardware and software issues, which ranked last with a composite weighted mean of 4.07.
Across respondent groups, school heads gave the highest overall rating at 4.62, Highly Evident, followed by supervisors at 4.43 and non-teaching personnel at 4.34, both also Highly Evident, while teachers rated this indicator lowest, at 4.15, still within the Evident range.
These results point to a generally strong level of digital literacy across supervisors, school heads, non-teaching personnel, and teachers, with particular strength in operating digital devices and productivity software. The comparatively
Table 7. Digital Aptitudes in Public Elementary Schools As to Digital Literacy
| Legend: | Range | ScaleVerbal Interpretation | Symbol |
| 5 | 4.20-5.00 Highly Evident | HE | |
| 4 | 3.40-4.19 Evident | E | |
| 3 | 2.60-3.39 Moderately Evident | ME | |
| 2 | 1.80-2.59 Least Evident | LE | |
| 1 | 1.00-1.79 Not Evident | NE |
lower rating for troubleshooting, however, signals a specific area that could hinder smooth technology use in classrooms,
and the fact that teachers rated themselves lower than the other groups suggests that targeted professional development may be needed to build their digital confidence.
-
This finding is consistent with Dela Cruz et al. (2026), who likewise found that while educators are comfortable with commonly used digital tools, a gap remains in more advanced competencies and troubleshooting Instructional Technology Integration
-
As Table 8 indicates, instructional technology integration was rated Highly Evident overall, with a composite weighted mean of 4.24. Six indicators reached the Highly Evident range. Consistent use of multimedia presentations such as PowerPoint, Prezi, or Canva in teaching topped the list at 4.43, followed by selecting the most appropriate digital tools for specific learning objectives in second place at
4.31. Using technology to differentiate instruction according to learners' abilities ranked third at 4.30, ahead of aligning technology-enhanced activities with DepEd curriculum standards in fourth place at 4.29. Using digital simulations, videos, and animations to illustrate abstract
concepts ranked fifth at 4.24, followed by using technology to assess learning outcomes efficiently in sixth place at
4.21. The remaining four indicators were rated Evident: creating collaborative online learning experiences through shared platforms and consistently evaluating the effectiveness of technology integration tied for seventh and eighth place, each earning 4.19; confidence in experimenting with emerging educational technologies followed in ninth place at 4.16; and integrating interactive tools such as Kahoot!, Quizizz, or Padlet to boost engagement ranked last at 4.07.
By respondent group, school heads rated this area highest at 4.52, Highly Evident, followed by non-teaching personnel at 4.31, also Highly Evident; teachers, at 4.10, and supervisors, at 4.02, both rated it Evident.
Overall, instructional technology integration is rated Highly Evident, particularly by school heads and non-teaching personnel, with clear strengths in multimedia use, tool selection, and differentiated instruction. Teachers and supervisors, however, rated this area somewhat lower,
| Indicators | Supervisors | School Heads | Teachers | Non-Teaching Personnels | Composite | Rank | |||||
| WM | VI | WM | VI | WM | VI | WM | VI | WM | VI | ||
| 1. Consistent use of multimedia presentations (PowerPoint, Prezi, or Canva) in teaching lessons. | 4.13 | E | 4.67 | HE | 4.40 | HE | 4.51 | HE | 4.43 | HE | 1 |
| 2. Integration of interactive tools (Kahoot!,Quizizz,Padlet)to enhance student engagement. | 4.00 | E | 4.40 | HE | 3.76 | E | 4.10 | E | 4.07 | E | 10 |
| 3. Use of digital simulations, videos, and animations to illustrate abstract concepts. | 4.13 | E | 4.40 | HE | 4.07 | E | 4.37 | HE | 4.24 | HE | 5 |
| 4. Alignment of technology-enhanced activities with DepEd curriculum standards. | 4.13 | E | 4.60 | HE | 4.12 | E | 4.32 | HE | 4.29 | HE | 4 |
| 5. Ability to use technology to differentiate instruction according to learners’ abilities. | 4.13 | E | 4.53 | HE | 4.16 | E | 4.39 | HE | 4.30 | HE | 3 |
| 6. Selection of the most appropriate digital tools for specific learning objectives. | 4.13 | E | 4.60 | HE | 4.13 | E | 4.37 | HE | 4.31 | HE | 2 |
| 7. Ability to create collaborative online learning experiences using shared platforms. | 3.88 | E | 4.60 | HE | 4.04 | E | 4.22 | HE | 4.19 | E | 7.5 |
| 8. Use of technology to assess student learning outcomes efficiently. | 3.88 | E | 4.53 | HE | 4.15 | E | 4.27 | HE | 4.21 | HE | 6 |
| 9. Confidence in experimenting with emerging educational technologies in instruction. | 3.88 | E | 4.40 | HE | 4.04 | E | 4.32 | HE | 4.16 | E | 9 |
| 10.Consistent evaluation of the effectiveness of technology integration on student learning. | 3.88 | E | 4.47 | HE | 4.12 | E | 4.27 | HE | 4.19 | E | 7.5 |
| Overall Weighted Mean | 4.02 | E | 4.52 | HE | 4.10 | E | 4.31 | HE | 4.24 | HE |
especially where interactive engagement tools, experimentation with new technologies, and collaborative online learning are concerned.
Bates (2024) offers a plausible explanation for this pattern, arguing that successful technology integration depends less on the tools themselves than on educators'
pedagogical confidence and creativity in applying them, and that sustained training and encouragement to explore new platforms are what ultimately allow teachers to differentiate instruction effectively.
Online Classroom Management
| Indicators | Supervisors | School Heads | Teachers | Non-Teaching Personnels | Composite | Rank | |||||
| WM | VI | WM | VI | WM | VI | WM | VI | WM | VI | ||
| 1.Establishment of clear rule and routines for online classes. | 4.13 | E | 4.53 | HE | 4.12 | E | 4.24 | HE | 4.26 | HE | 3.5 |
| 2.Establishment of expectations for online classes. | 4.13 | E | 4.53 | HE | 4.06 | E | 4.20 | HE | 4.23 | HE | 5.33 |
| 3.Use of interactive polls, chat, and breakout rooms to maintain student engagement. | 4.00 | E | 4.53 | HE | 4.11 | E | 4.29 | HE | 4.23 | HE | 5.33 |
| 4.Ability to address student misbehavior or distractions during virtual lessons. | 3.88 | E | 4.53 | HE | 4.05 | E | 4.20 | HE | 4.17 | E | 9 |
| 5.Use of online tools to track progress, participation, and submission of tasks. | 3.88 | E | 4.47 | HE | 4.03 | E | 4.27 | HE | 4.16 | E | 10 |
| 6.Clearcommunicationoflearning objectives, instructions, and deadlines online. | 3.88 | E | 4.60 | HE | 4.18 | E | 4.37 | HE | 4.26 | HE | 3.5 |
| 7.Ability to create a supportive and inclusive online learning environment. | 3.88 | E | 4.53 | HE | 4.13 | E | 4.32 | HE | 4.22 | HE | 8 |
| 8.Timely feedback and follow-up with students during online sessions. | 4.00 | E | 4.53 | HE | 4.11 | E | 4.29 | HE | 4.23 | HE | 5.33 |
| 9.Effectivetimemanagementduring synchronous and asynchronous classes. | 4.13 | E | 4.53 | HE | 4.21 | HE | 4.37 | HE | 4.31 | HE | 2 |
| 10. Use of platform features (mute / unmute, screen share, etc.) to maintain focus and order. | 4.13 | E | 4.53 | HE | 4.27 | HE | 4.39 | HE | 4.33 | HE | 1 |
| Overall Weighted Mean | 4.00 | E | 4.53 | HE | 4.13 | E | 4.29 | HE | 4.24 | HE |
-
Table 9 reflects that online classroom management was rated Highly Evident overall, with a composite weighted mean of
4.24. Eight of the ten indicators reached the Highly Evident
range. Using platform features such as mute/unmute and screen share to maintain focus and order ranked first at 4.33, followed by effective time management during synchronous and asynchronous classes in second place at
4.31. Establishing clear rules and routines for online classes and clearly communicating learning objectives, instructions, and deadlines tied for third and fourth place, each earning 4.26. Establishing expectations for online classes, using interactive polls, chat, and breakout rooms, and providing timely feedback during online sessions tied for fifth through seventh place, each at 4.23, followed by creating a supportive, inclusive online learning environment in eighth place at 4.22. Two indicators were rated Evident: addressing student misbehavior or distractions during virtual lessons, which ranked ninth at 4.17, and using online tools to track progress, participation, and task submission, which ranked last at 4.16.
-
Among respondent groups, school heads gave the highest rating at 4.53, Highly Evident, followed by non-teaching
personnel at 4.29, also Highly Evident; teachers, at 4.13, and supervisors, at 4.00, both rated this area Evident.
-
Online classroom management is thus rated Highly Evident overall, with school heads and non-teaching personnel expressing more confidence than teachers and supervisors. Strengths lie in the use of platform features, time management, and clear communication of objectives, while managing misbehavior and tracking student progress online proved comparatively more difficult.
-
This pattern echoes Santos and Ramos (2025), who found that educators handle basic virtual classroom tools well but continue to struggle with sustaining engagement and monitoring learning outcomes online, underscoring the need for ongoing training in managing digital learning environments more comprehensively.
Content Creation and Curation
As Table 10 depicts, content creation and curation were rated Highly Evident overall, with a composite weighted mean of 4.25. Eight indicators reached the Highly Evident range. Appropriate use of copyright-free or licensed materials ranked
Table 10. Digital Aptitudes in Public Elementary Schools As to Content Creation and Curation
| Indicators | Supervisors | School Heads | Teachers | Non-Teaching Personnels | Composite | Rank | |||||
| WM | VI | WM | VI | WM | VI | WM | VI | WM | VI | ||
| 1. Creation of original lesson materials, such as interactive presentations, videos, and worksheets. | 4.13 | E | 4.53 | HE | 4.12 | E | 4.27 | HE | 4.26 | HE | 5 |
| 2.Customization of content to meet the diverse learning needs of students. | 4.13 | E | 4.47 | HE | 4.07 | E | 4.17 | E | 4.21 | HE | 7 |
| 3.Systematic organization of digital teaching resources for easy access and reuse. | 4.13 | E | 4.53 | HE | 4.08 | E | 4.22 | HE | 4.24 | HE | 6 |
| 4. Curation of age-appropriate and relevant online materials aligned with the DepEd curriculum. | 4.00 | E | 4.47 | HE | 4.07 | E | 4.27 | HE | 4.20 | HE | 8 |
| 5. Incorporation of multimedia elements (images, audio, video) to enhance learning experiences. | 4.25 | HE | 4.60 | HE | 4.19 | E | 4.34 | HE | 4.35 | HE | 2 |
| 6.Adaptation of resources to various grade levels and learning competencies. | 3.88 | E | 4.60 | HE | 4.08 | E | 4.20 | HE | 4.19 | E | 9 |
| 7.Use of copyright-free or licensed materials appropriately. | 4.38 | HE | 4.67 | HE | 4.14 | E | 4.29 | HE | 4.37 | HE | 1 |
| 8.Regular updating of instructional content to reflect current knowledge and digital trends. | 4.13 | E | 4.53 | HE | 4.14 | E | 4.32 | HE | 4.28 | HE | 3.5 |
| 9.Creative use of gamified elements to make lessons more engaging. | 3.88 | E | 4.40 | HE | 4.01 | E | 4.27 | HE | 4.14 | E | 10 |
| 10. Evaluation of content quality, accuracy, and alignment with learning objectives. | 4.13 | E | 4.53 | HE | 4.15 | E | 4.29 | HE | 4.28 | HE | 3.5 |
| Overall Weighted Mean | 4.10 | E | 4.53 | HE | 4.11 | E | 4.26 | HE | 4.25 | HE |
highest at 4.37, followed by incorporating multimedia elements such as images, audio, and video to enhance learning in second place at 4.35. Regularly updating instructional content and evaluating content quality and alignment with objectives tied for third and fourth place, each earning 4.28. Creating original lesson materials such as interactive presentations, videos, and worksheets ranked fifth at 4.26, ahead of systematically organizing digital teaching resources in sixth
place at 4.24. Customizing content for diverse learning needs ranked seventh at 4.21, followed by curating age-appropriate materials aligned with the DepEd curriculum in eighth place at
4.20. Two indicators were rated Evident: adapting resources to various grade levels and competencies, which ranked ninth at 4.19, and creatively using gamified elements to make lessons more engaging, which ranked last at 4.14.
By respondent group, school heads rated this area highest at 4.53, Highly Evident, followed by non-teaching personnel at 4.26, also Highly Evident; teachers, at 4.11, and supervisors, at 4.10, both rated it Evident.
The generally strong ratings for content creation and curation suggest that educators are incorporating multimedia and current materials while respecting copyright, supporting richer and more relevant learning experiences.
This finding aligns with Aquino and Olabiyi (2025), who found that skilled educators make effective use of multimedia and carefully curated digital resources to boost engagement and who stress that continual professional development in content customization and ethical material use is essential to
sustaining instructional quality.
Cybersecurity Awareness
| Indicators | Supervisors | Schoo Heads | Teachers | Non-Teaching Personnels | Composite | Rank | |||||
| WM | VI | WM | VI | WM | VI | WM | VI | WM | VI | ||
| 1. Awareness of common cybersecurity threats such as phishing, malware, and ransomware. | 4.63 | HE | 4.73 | HE | 4.19 | E | 4.39 | HE | 4.49 | HE | 4 |
| 2. Implementation of strong passwords and secure authentication methods for accounts. | 4.88 | HE | 4.60 | HE | 4.20 | HE | 4.34 | HE | 4.51 | HE | 2 |
| 3. Knowledge of how to identify suspicious emails and links. | 4.50 | HE | 4.47 | HE | 4.07 | E | 4.24 | HE | 4.32 | HE | 10 |
| 4. Proper handling of sensitive student information and administrative records. | 4.50 | HE | 4.67 | HE | 4.21 | HE | 4.44 | HE | 4.46 | HE | 6 |
| 5. Awareness of the DepEd ICT security policies and guidelines. | 4.50 | HE | 4.67 | HE | 4.25 | HE | 4.46 | HE | 4.47 | HE | 5 |
| 6. Safe use of school-issued and personal devices in professional contexts. | 4.63 | HE | 4.73 | HE | 4.29 | HE | 4.49 | HE | 4.54 | HE | 1 |
| 7. Updating software and systems to ensure protection from vulnerabilities. | 4.38 | HE | 4.60 | HE | 4.11 | E | 4.37 | HE | 4.37 | HE | 9 |
| 8. Responsible for sharing of files, documents, and online resources. | 4.50 | HE | 4.67 | HE | 4.28 | HE | 4.54 | HE | 4.50 | HE | 3 |
| 9. Reporting cyber threats or incidents according to school protocols. | 4.25 | HE | 4.67 | HE | 4.14 | E | 4.44 | HE | 4.38 | HE | 8 |
| 10.Promotion of cyber safety awareness among students. | 4.50 | HE | 4.67 | HE | 4.18 | E | 4.41 | HE | 4.44 | HE | 7 |
| Overall Weighted Mean | 4.53 | HE | 4.65 | HE | 4.19 | E | 4.41 | HE | 4.44 | HE |
-
Table 11 demonstrates that cybersecurity awareness received the highest overall rating among the digital literacy-related indicators discussed so far, earning a composite weighted mean of 4.44, Highly Evident, with every single item falling in the Highly Evident range. Safe use of school-issued and personal devices in professional contexts ranked
first at 4.54, followed by implementation of strong passwords and secure authentication methods in second place at 4.51. Responsible sharing of files, documents, and online resources ranked third at 4.50, ahead of awareness of common threats such as phishing, malware, and ransomware in fourth place at 4.49. Awareness of DepEd ICT security policies and guidelines ranked fifth at 4.47, followed by proper handling of sensitive student information and administrative records in sixth place at 4.46. Promotion of cyber safety awareness among students ranked seventh at 4.44, ahead of reporting cyber threats or incidents according to school protocols in eighth place at 4.38. Keeping software and systems updated against vulnerabilities ranked ninth at 4.37, while identifying suspicious emails and links ranked last at 4.32.
-
Among respondent groups, school heads and supervisors both rated this area Highly Evident, at 4.65 and 4.53 respectively, as did non-teaching personnel at 4.41; teachers rated it somewhat lower, at 4.19, which still falls in the Evident range.
-
This consistently strong cybersecurity awareness suggests that school personnel are generally well-prepared to protect digital environments through secure device use, strong password practices, and adherence to ICT security policy — all essential to maintaining safe online learning spaces.
-
Valenzuela and Soriano (2025) offer a similar conclusion, noting that effective cybersecurity in schools depends on thorough knowledge and responsible information handling by personnel, and recommending continuous awareness programs to sustain protection against evolving cyber threats.
Digital Communication Skills
-
Table 12 illustrates that digital communication skills were rated Highly Evident overall, earning a composite weighted mean of 4.48, with every indicator falling in the Highly Evident range. Professional use of email, chat, and messaging platforms for school-related tasks ranked first at 4.54, followed by efficient use of communication tools for announcements and reminders in second place at 4.53. The ability to collaborate
| Indicators | Supervisors | School Heads | Teachers | Non-Teaching Personnels | Composite | Rank | |||||
| WM | VI | WM | VI | WM | VI | WM | VI | WM | VI | ||
| 1. Clarity and conciseness in written digital communication with students, parents, and colleagues. | 4.38 | HE | 4.80 | HE | 4.19 | E | 4.37 | HE | 4.44 | HE | 9 |
| 2. Professional use of email, chat, and messaging platforms in school- related tasks. | 4.50 | HE | 4.73 | HE | 4.35 | HE | 4.56 | HE | 4.54 | HE | 1 |
| 3. Ability to convey instructions and learningexpectationsonline effectively. | 4.38 | HE | 4.67 | HE | 4.29 | HE | 4.54 | HE | 4.47 | HE | 6 |
| 4. Responsiveness to digital communications within an appropriate timeframe. | 4.38 | HE | 4.80 | HE | 4.30 | HE | 4.54 | HE | 4.51 | HE | 4.5 |
| 5. Maintaining proper digital etiquette and respectful tone in all communications. | 4.38 | HE | 4.73 | HE | 4.35 | HE | 4.56 | HE | 4.51 | HE | 4.5 |
| 6. Ability to collaborate and coordinate digitally with fellow educators and staff. | 4.38 | HE | 4.80 | HE | 4.32 | HE | 4.56 | HE | 4.52 | HE | 3 |
| 7. Ability to collaborate and coordinate digitally with fellow educators and staff. | 4.38 | HE | 4.60 | HE | 4.30 | HE | 4.54 | HE | 4.46 | HE | 7 |
| 8. Efficient use of communication tools for school announcements and reminders. | 4.38 | HE | 4.80 | HE | 4.33 | HE | 4.59 | HE | 4.53 | HE | 2 |
| 9. Ability to resolve issues and clarify misunderstandings digitally. | 4.25 | HE | 4.67 | HE | 4.21 | HE | 4.41 | HE | 4.39 | HE | 10 |
| 10.Documentation and archiving of importantcommunicationsfor accountability. | 4.25 | HE | 4.73 | HE | 4.28 | HE | 4.54 | HE | 4.45 | HE | 8 |
| Overall Weighted Mean | 4.37 | HE | 4.73 | HE | 4.29 | HE | 4.52 | HE | 4.48 | HE |
and coordinate digitally with fellow educators and staff ranked third at 4.52, ahead of responsiveness to digital communications within an appropriate timeframe and maintaining proper digital etiquette, which tied for fourth and fifth place, each at 4.51. The ability to convey instructions and learning expectations online effectively ranked sixth at 4.47, followed by a repeated collaboration-related item in seventh place at 4.46. Documentation and
archiving of important communications for accountability ranked eighth at 4.45, ahead of clarity and conciseness in written digital communication in ninth place at 4.44. The ability to resolve issues and clarify misunderstandings digitally ranked last at 4.39.
-
By respondent group, school heads rated this area highest at 4.73, followed by non-teaching personnel at 4.52, supervisors at 4.37, and teachers at 4.29 — all within the Highly Evident range.
-
The consistently strong ratings across all indicators suggest that clear, professional, and respectful digital communication is well established in these schools, supporting collaboration, responsiveness, and a positive working environment.
-
Aquino and Olabiyi (2025) similarly found that proficient digital communication among educators strengthens teamwork, stakeholder engagement, and instructional clarity, and note that continued training in digital etiquette and communication tools helps sustain effective, accountable interactions within schools.
Use of Educational Platforms
| Indicators | Supervisors | School Heads | Teachers | Non-Teaching Personnels | Composite | Rank | |||||
| WM | VI | WM | VI | WM | VI | WM | VI | WM | VI | ||
| 1.Familiarity with learning management systems like DepEd Commons, Google Classroom, or Moodle. | 4.25 | HE | 4.73 | HE | 4.17 | E | 4.34 | HE | 4.37 | HE | 2.5 |
| 2.Ability to navigate and upload instructionalmaterialsand assignments on platforms. | 4.25 | HE | 4.67 | HE | 4.19 | E | 4.34 | HE | 4.36 | HE | 4 |
| 3.Use of platforms to assess learner performance and provide feedback. | 4.25 | HE | 4.67 | HE | 4.12 | E | 4.27 | HE | 4.33 | HE | 6 |
| 4.Tracking and monitoring student progress through analytics features. | 4.13 | E | 4.60 | HE | 4.08 | E | 4.20 | HE | 4.25 | HE | 10 |
| 5.Use of interactive tools such as quizzes, discussion boards, and polls. | 4.25 | HE | 4.67 | HE | 4.16 | E | 4.32 | HE | 4.35 | HE | 5 |
| 6.Troubleshooting minor platform issues independently or collaboratively. | 4.25 | HE | 4.53 | HE | 4.01 | E | 4.24 | HE | 4.26 | HE | 9 |
| 7.Guiding students in using online platforms effectively. | 4.25 | HE | 4.53 | HE | 4.11 | E | 4.29 | HE | 4.30 | HE | 7 |
| 8. Regular and consistent use of platforms to enhance learning outcomes. | 4.25 | HE | 4.60 | HE | 4.08 | E | 4.24 | HE | 4.29 | HE | 8 |
| 9.Collaboration with peers to improve platform utilization. | 4.25 | HE | 4.60 | HE | 4.19 | E | 4.49 | HE | 4.38 | HE | 1 |
| 10. Openness to adopt new platforms or digital tools introduced by the school or DepEd. | 4.25 | HE | 4.67 | HE | 4.19 | E | 4.37 | HE | 4.37 | HE | 2.5 |
| Overall Weighted Mean | 4.24 | HE | 4.63 | HE | 4.13 | E | 4.31 | HE | 4.33 | HE |
-
Table 13 confirms that use of educational platforms was rated Highly Evident overall, earning a composite weighted mean of 4.33, with all ten indicators in the Highly Evident range. Collaborating with peers to improve platform utilization ranked first at 4.38, followed by familiarity with learning management systems such as DepEd Commons, Google Classroom, or Moodle, and openness to adopting new
platforms introduced by the school or DepEd, which tied for second and third place, each at 4.37. The ability to navigate and upload instructional materials ranked fourth at 4.36, ahead of the use of interactive tools such as quizzes, discussion boards, and polls in fifth place at 4.35. Using platforms to assess learner performance and provide feedback ranked sixth at 4.33, followed by guiding students in using online platforms effectively in seventh place at 4.30. Regular and consistent platform use to enhance learning outcomes ranked eighth at 4.29, ahead of troubleshooting minor platform issues independently or collaboratively in ninth place at 4.26. Tracking student progress through analytics features ranked last at 4.25.
-
By respondent group, school heads rated this area highest at 4.63, Highly Evident, followed by non-teaching personnel at 4.31 and supervisors at 4.24, both also Highly Evident; teachers rated it slightly lower, at 4.13, within the Evident range.
-
These results suggest that educators are collaborating effectively and adapting well to various learning management
systems, which in turn supports stronger instructional delivery and more consistent student engagement through regular platform use.
-
Santos and Ramos (2025) similarly found that active collaboration among educators improves how well learning management systems and educational technologies are used, and identify familiarity with digital platforms and openness to new tools as key drivers of teaching effectiveness and learner participation.
-
Table 14 highlights that problem-solving in digital contexts was rated Highly Evident overall, earning a composite weighted mean of 4.32, with all ten indicators in the Highly Evident range. Sharing problem-solving strategies with peers for collective improvement ranked first at 4.41, followed by using online resources to address digital challenges, learning from previous experiences to prevent recurring issues, and applying innovative approaches to technology-related obstacles, which tied for second through fourth place, each at 4.35. Collaborating with colleagues to solve technology-related issues ranked fifth at 4.34,
| Indicators | Supervisors | School Heads | Teachers | Non-Teaching Personnels | Composite | Rank | |||||
| WM | VI | WM | VI | WM | VI | WM | VI | WM | VI | ||
| 1. Identifying technical issues during lessons and finding immediate solutions. | 4.13 | E | 4.53 | HE | 4.15 | E | 4.41 | HE | 4.31 | HE | 7.5 |
| 2. Using online resources to addressclassroomand administrativedigital challenges. | 4.13 | E | 4.73 | HE | 4.16 | E | 4.37 | HE | 4.35 | HE | 2.33 |
| 3. Applying logical thinking to troubleshoot digital problems efficiently. | 4.13 | E | 4.67 | HE | 4.04 | E | 4.32 | HE | 4.29 | HE | 9 |
| 4. Adjusting digital solutions to fit specific school or classroom situations. | 4.00 | E | 4.60 | HE | 4.03 | E | 4.27 | HE | 4.23 | HE | 10 |
| 5. Collaborating with colleagues to solve technology-related issues. | 4.00 | E | 4.73 | HE | 4.21 | HE | 4.41 | HE | 4.34 | HE | 5 |
| 6. Utilizing digital resources to enhanceproblem-solving skills. | 4.13 | E | 4.67 | HE | 4.09 | E | 4.34 | HE | 4.31 | HE | 7.5 |
| 7. Demonstratingpersistence and patience in resolving technical difficulties. | 4.13 | E | 4.67 | HE | 4.09 | E | 4.37 | HE | 4.32 | HE | 6 |
| 8. Learning from previous experiences to prevent recurring digital issues. | 4.13 | E | 4.73 | HE | 4.13 | E | 4.39 | HE | 4.35 | HE | 2.33 |
| 9. Applyinginnovative approaches to overcome technology-related obstacles. | 4.13 | E | 4.73 | HE | 4.13 | E | 4.39 | HE | 4.35 | HE | 2.33 |
| 10.Sharingproblem-solving strategies with peers for collective improvement. | 4.25 | HE | 4.80 | HE | 4.19 | E | 4.39 | HE | 4.41 | HE | 1 |
| Overall Weighted Mean | 4.12 | E | 4.69 | HE | 4.12 | E | 4.37 | HE | 4.32 | HE |
ahead of demonstrating persistence and patience in resolving technical difficulties in sixth place at 4.32. Identifying technical issues during lessons and utilizing digital resources to enhance problem-solving skills tied for seventh
and eighth place, each at 4.31, followed by applying logical thinking to troubleshoot digital problems efficiently in ninth place at 4.29. Adjusting digital solutions to fit specific school or classroom situations ranked last at 4.23.
-
Among respondent groups, school heads rated this area highest at 4.69, Highly Evident, followed by non-teaching personnel at 4.37, also Highly Evident; supervisors and teachers rated it identically, at 4.12, within the Evident range.
-
The strong overall ratings suggest that collaboration, persistence, and the sharing of strategies among school personnel meaningfully strengthen their capacity to resolve technology-related challenges as they arise.
-
O'Connor and Jenkins (2025) reach a similar conclusion, finding that problem-solving in digital contexts improves within collaborative learning communities where educators exchange strategies and learn from one another's experience, and emphasizing that persistence and adaptability are key to overcoming technical difficulties.
Adaptability to Emerging Technologies
| Indicators | Supervisors | School Heads | Teachers | Non-Teaching Personnels | Composite | Rank | |||||
| WM | VI | WM | VI | WM | VI | WM | VI | WM | VI | ||
| 1. Willingnesstoadoptnew educationaltechnologies introduced in schools. | 4.25 | HE | 4.73 | HE | 4.30 | HE | 4.44 | HE | 4.43 | HE | 3 |
| 2. Ability to adjust teaching methods to new digital tools and platforms. | 4.25 | HE | 4.67 | HE | 4.25 | HE | 4.37 | HE | 4.39 | HE | 7 |
| 3. Readiness to learn and implement new software or hardware for instruction. | 4.25 | HE | 4.67 | HE | 4.27 | HE | 4.44 | HE | 4.41 | HE | 4.33 |
| 4. Confidence in exploring unfamiliar technologies. | 4.25 | HE | 4.73 | HE | 4.17 | E | 4.29 | HE | 4.36 | HE | 9 |
| 5. Flexibility in integrating alternative digital resources into lessons. | 4.25 | HE | 4.60 | HE | 4.14 | E | 4.32 | HE | 4.33 | HE | 10 |
| 6. Continuousupdatingof professional digital skills. | 4.25 | HE | 4.73 | HE | 4.22 | HE | 4.44 | HE | 4.41 | HE | 4.33 |
| 7. Positiveattitudetowards technology-driventeaching reforms. | 4.38 | HE | 4.60 | HE | 4.29 | HE | 4.51 | HE | 4.45 | HE | 1.5 |
| 8. Opennesstoprofessional developmentopportunitiesin technology integration. | 4.25 | HE | 4.73 | HE | 4.31 | HE | 4.51 | HE | 4.45 | HE | 1.5 |
| 9. Rapid adjustment to technology changes in both classroom and administrative work. | 4.25 | HE | 4.67 | HE | 4.26 | HE | 4.46 | HE | 4.41 | HE | 4.33 |
| 10.Encouraging students to embrace and utilize emerging technologies. | 4.13 | E | 4.67 | HE | 4.26 | HE | 4.46 | HE | 4.38 | HE | 8 |
| Overall Weighted Mean | 4.25 | HE | 4.68 | HE | 4.25 | HE | 4.42 | HE | 4.40 | HE |
-
Table 15 presents adaptability to emerging technologies as rated Highly Evident overall, earning a composite weighted mean of 4.40, with all ten indicators in the Highly Evident range. A positive attitude toward technology-driven teaching reforms and openness to professional development in
technology integration tied for first place, each at 4.45, followed by willingness to adopt new educational technologies in third place at 4.43. Readiness to learn new software or hardware, continuous updating of professional digital skills, and rapid adjustment to technology changes in classroom and administrative work tied for fourth through sixth place, each at 4.41. The ability to adjust teaching methods to new digital tools ranked seventh at 4.39, ahead of encouraging students to embrace emerging technologies in eighth place at 4.38. Confidence in exploring unfamiliar technologies ranked ninth at 4.36, while flexibility in integrating alternative digital resources into lessons ranked last at 4.33.
-
By respondent group, school heads rated this area highest at 4.68, Highly Evident, followed by non-teaching personnel at 4.42, also Highly Evident; supervisors and teachers rated it identically, at 4.25, also within the Highly Evident range.
-
This strong overall adaptability suggests that school personnel are well positioned to embrace and integrate new
digital tools and teaching reforms — an important condition for successful digital transformation. Sustaining this readiness will likely depend on continued professional development and a supportive culture of ongoing learning.
-
Fullan and Gallagher (2022) support this reading, finding that a positive mindset toward technology-driven reform and openness to professional development significantly shape educators' capacity to adapt to and implement emerging technologies, and that sustained learning opportunities and a supportive school culture help maintain successful digital integration over time.
Digital Ethics and Responsibility
Table 16 establishes that digital ethics and responsibility were rated Highly Evident overall, earning a composite weighted mean of 4.48, with all ten indicators in the Highly Evident range. Respecting intellectual property rights and modeling responsible, ethical digital behavior consistently tied for first place, each at 4.51, followed by responsible use of social media and digital communication channels in third place
| Indicators | Supervisors | School Heads | Teachers | Non-Teaching Personnels | Composite | Rank | |||||
| WM | VI | WM | VI | WM | VI | WM | VI | WM | VI | ||
| 1. Following ethical guidelines for online behavior in school and personal contexts. | 4.38 | HE | 4.73 | HE | 4.30 | HE | 4.46 | HE | 4.47 | HE | 7.5 |
| 2. Respecting intellectual property rights when using digital resources. | 4.38 | HE | 4.80 | HE | 4.36 | HE | 4.51 | HE | 4.51 | HE | 1.5 |
| 3. Responsible use of social media anddigitalcommunication channels. | 4.25 | HE | 4.80 | HE | 4.38 | HE | 4.56 | HE | 4.50 | HE | 3 |
| 4. Avoiding plagiarism in all digital instructional content. | 4.13 | E | 4.80 | HE | 4.40 | HE | 4.61 | HE | 4.49 | HE | 4.33 |
| 5. Teaching students’ responsible digital citizenship. | 4.38 | HE | 4.67 | HE | 4.32 | HE | 4.51 | HE | 4.47 | HE | 7.5 |
| 6. Maintainingintegritywhen handling online assessments. | 4.13 | E | 4.80 | HE | 4.30 | HE | 4.51 | HE | 4.44 | HE | 9.5 |
| 7. Awareness of legal consequences for unethical digital practices. | 4.13 | E | 4.73 | HE | 4.34 | HE | 4.56 | HE | 4.44 | HE | 9.5 |
| 8. Encouraging peers and students to practice ethical technology use. | 4.38 | HE | 4.67 | HE | 4.36 | HE | 4.56 | HE | 4.49 | HE | 4.33 |
| 9. Ensuringallshareddigital materials comply with copyright laws. | 4.25 | HE | 4.73 | HE | 4.37 | HE | 4.61 | HE | 4.49 | HE | 4.33 |
| 10.Modeling responsible and ethicaldigitalbehavior consistently. | 4.25 | HE | 4.80 | HE | 4.37 | HE | 4.61 | HE | 4.51 | HE | 1.5 |
| Overall Weighted Mean | 4.27 | HE | 4.75 | HE | 4.35 | HE | 4.55 | HE | 4.48 | HE |
at 4.50. Avoiding plagiarism in digital instructional content, encouraging peers and students to practice ethical technology use, and ensuring shared digital materials comply with copyright law tied for fourth through sixth place, each at
4.49. Following ethical guidelines for online behavior and
teaching students responsible digital citizenship tied for seventh and eighth place, each at 4.47, while maintaining integrity in online assessments and awareness of legal consequences for unethical digital practices tied for last place, each at 4.44.
By respondent group, school heads rated this area highest at 4.75, Highly Evident, followed by non-teaching personnel at 4.55, teachers at 4.35, and supervisors at 4.27 — all within the Highly Evident range.
The consistently high ratings across all roles point to a strong shared culture of ethical digital behavior, one that likely models responsible technology use for students as well. This pattern also suggests that existing training and support around digital ethics are working and should be sustained to preserve legal compliance and high standards going forward.
Valenzuela and Soriano (2025) similarly emphasize that when educators consistently model ethical digital behavior, it meaningfully shapes students' own digital citizenship and argue that continuing education in digital ethics remains essential to sustaining a safe, legally compliant learning
environment.
Data Management Preservation
| Indicators | Supervisors | School Heads | Teachers | Non-Teaching Personnels | Composite | Rank | |||||
| WM | VI | WM | VI | WM | VI | WM | VI | WM | VI | ||
| 1. Organizing digital records and resources systematically for easy retrieval. | 4.25 | HE | 4.60 | HE | 4.26 | HE | 4.54 | HE | 4.41 | HE | 6 |
| 2. Securelystoringsensitive student and school data. | 4.38 | HE | 4.80 | HE | 4.31 | HE | 4.54 | HE | 4.51 | HE | 2 |
| 3. Conducting regular backups of essential digital files. | 4.38 | HE | 4.67 | HE | 4.21 | HE | 4.46 | HE | 4.43 | HE | 4 |
| 4. Maintaining accurate records of studentassessmentsand administrative documents. | 4.38 | HE | 4.73 | HE | 4.35 | HE | 4.63 | HE | 4.52 | HE | 1 |
| 5. Using digital tools to monitor and track data effectively.in actual classroom practice. | 4.25 | HE | 4.67 | HE | 4.24 | HE | 4.51 | HE | 4.42 | HE | 5 |
| 6. Ensuring compliance with DepEd data management guidelines. | 4.25 | HE | 4.80 | HE | 4.34 | HE | 4.61 | HE | 4.50 | HE | 3 |
| 7. Implementing version control for lesson plans and digital resources. | 4.25 | HE | 4.60 | HE | 4.23 | HE | 4.49 | HE | 4.39 | HE | 7.5 |
| 8. Minimizingdatalossrisks throughsecurestorage practices. | 4.25 | HE | 4.73 | HE | 4.17 | E | 4.41 | HE | 4.39 | HE | 7.5 |
| 9. Training or guiding others on properdatamanagement procedures. | 4.00 | E | 4.67 | HE | 4.11 | E | 4.37 | HE | 4.29 | HE | 10 |
| 10.Periodically reviewing data organization and updating systems as needed. | 4.25 | HE | 4.67 | HE | 4.15 | E | 4.44 | HE | 4.38 | HE | 9 |
| Overall Weighted Mean | 4.26 | HE | 4.69 | HE | 4.24 | HE | 4.50 | HE | 4.42 | HE |
-
Table 17 points to data management preservation as rated Highly Evident overall, earning a composite weighted mean of 4.42, with all ten indicators in the Highly Evident range.
Maintaining accurate records of student assessments and administrative documents ranked first at 4.52, followed by securely storing sensitive student and school data in second place at 4.51. Ensuring compliance with DepEd data management guidelines ranked third at 4.50, ahead of conducting regular backups of essential digital files in fourth place at 4.43. Using digital tools to monitor and track data effectively in actual classroom practice ranked fifth at 4.42, followed by organizing digital records systematically for easy retrieval in sixth place at 4.41. Implementing version control for lesson plans and minimizing data loss risks through secure storage tied for seventh and eighth place, each at 4.39, ahead of periodically reviewing data organization and updating systems as needed in ninth place at 4.38. Training or guiding others on proper data management procedures ranked last at 4.29.
-
By respondent group, school heads rated this area highest at 4.69, Highly Evident, followed by non-teaching personnel at 4.50, supervisors at 4.26, and teachers at 4.24 — all within the Highly Evident range.
-
This strong overall performance suggests that schools are prioritizing the security and accuracy of digital records, which should support better decision-making and greater accountability. The particularly high ratings from school heads and non-teaching personnel further point to the importance of leadership and interdepartmental collaboration in sustaining reliable data management practices.
-
Valenzuela and Soriano (2025) reach a similar conclusion, arguing that effective data management in schools depends heavily on strong leadership support and collaboration among staff, and that consistent adherence to data security protocols and systematic record-keeping is essential to institutional integrity and informed decision-making.
Digital Survival Skills
Table 18 outlines digital survival skills as rated Highly Evident overall, earning a composite weighted mean of 4.37, with all ten indicators in the Highly Evident range. Remaining resilient under pressure from technological change ranked first at 4.40, followed by continuing to improve digital
Table 18. Digital Aptitudes in Public Elementary Schools As to Digital Survival Skills
| Indicators | Supervisors | School Heads | Teachers | Non-Teaching Personnels | Composite | Rank | |||||
| WM | VI | WM | VI | WM | VI | WM | VI | WM | VI | ||
| 1. Functioning effectively in online teaching and administrative tasks. | 4.25 | HE | 4.67 | HE | 4.09 | E | 4.39 | HE | 4.35 | HE | 8.5 |
| 2. Managing workload efficiently using digital tools. | 4.25 | HE | 4.60 | HE | 4.13 | E | 4.41 | HE | 4.35 | HE | 8.5 |
| 3. Problem-solving in real-time during digital instruction. | 4.13 | E | 4.60 | HE | 4.10 | E | 4.41 | HE | 4.31 | HE | 10 |
| 4. Learning new digital tools independently to meet job requirements. | 4.13 | E | 4.60 | HE | 4.18 | E | 4.51 | HE | 4.36 | HE | 7 |
| 5. Coping with technological challenges without disrupting teaching. | 4.25 | HE | 4.53 | HE | 4.17 | E | 4.51 | HE | 4.37 | HE | 5.5 |
| 6. Managing time and tasks effectively using digital planners and tools. | 4.25 | HE | 4.53 | HE | 4.16 | E | 4.54 | HE | 4.37 | HE | 5.5 |
| 7. Remaining resilient under pressure from technological changes. | 4.25 | HE | 4.60 | HE | 4.19 | E | 4.54 | HE | 4.40 | HE | 1 |
| 8. Continuing to improve digital competence through professional development. | 4.25 | HE | 4.60 | HE | 4.21 | HE | 4.51 | HE | 4.39 | HE | 2.33 |
| 9. Maintainingperformanceduring technology failures or limitations. | 4.25 | HE | 4.60 | HE | 4.18 | E | 4.54 | HE | 4.39 | HE | 2.33 |
| 10.Preparing for future digital trends to ensure continued teaching effectiveness. | 4.25 | HE | 4.60 | HE | 4.19 | E | 4.51 | HE | 4.39 | HE | 2.33 |
| Overall Weighted Mean | 4.23 | HE | 4.59 | HE | 4.16 | E | 4.49 | HE | 4.37 | HE |
competence through professional development, maintaining performance during technology failures or limitations, and preparing for future digital trends, which tied for second through fourth place, each at 4.39. Coping with technological challenges without disrupting teaching and managing time and tasks using digital planners tied for fifth and sixth place, each at 4.37, ahead of learning new digital tools independently to meet job requirements in seventh place at 4.36. Functioning effectively in online teaching and administrative tasks and
managing workload efficiently using digital tools tied for eighth and ninth place, each at 4.35, while problem-solving in real time during digital instruction ranked last at 4.31.
By respondent group, school heads rated this area highest at 4.59, Highly Evident, followed by non-teaching personnel at
4.49 and supervisors at 4.23, both also Highly Evident; teachers rated it lowest, at 4.16, within the Evident range.
These results indicate that school personnel generally possess the resilience and adaptive capacity needed to sustain their work through technological disruption, with particular strength in coping with failures, continuing to build competence, and preparing for future digital demands. The comparatively lower rating from teachers on real-time problem-solving during instruction, however, suggests that this specific skill may benefit from more classroom-embedded practice and support.
This is consistent with Nguyen and Laurent (2025), who found that educators who demonstrate resilience and actively pursue ongoing professional development are better equipped to manage technological disruption and sustain instructional
quality, underscoring the value of fostering adaptability and perseverance in fast-changing digital environments.
| Criteria | Supervisors | School Heads | Teachers | Non-Teaching Personnels | Composite | Rank | |||||
| WM | VI | WM | VI | WM | VI | WM | VI | WM | VI | ||
| 1. Digital Literacy | 4.43 | HE | 4.62 | HE | 4.15 | E | 4.34 | HE | 4.39 | HE | 6 |
| 2. Instructional Technology Integration | 4.02 | E | 4.52 | HE | 4.10 | E | 4.31 | HE | 4.24 | HE | 11.5 |
| 3. Online Classroom Management | 4.00 | E | 4.53 | HE | 4.13 | E | 4.29 | HE | 4.24 | HE | 11.5 |
| 4. Content Creation and Curation | 4.10 | E | 4.53 | HE | 4.11 | E | 4.26 | HE | 4.25 | HE | 10 |
| 5. Cybersecurity Awareness | 4.53 | HE | 4.65 | HE | 4.19 | E | 4.41 | HE | 4.44 | HE | 3 |
| 6. Digital Communication Skills | 4.37 | HE | 4.73 | HE | 4.29 | HE | 4.52 | HE | 4.48 | HE | 1.5 |
| 7. Use of Educational Platforms | 4.24 | HE | 4.63 | HE | 4.13 | E | 4.31 | HE | 4.33 | HE | 8 |
| 8. Problem-Solving in Digital Contexts | 4.12 | E | 4.69 | HE | 4.12 | E | 4.37 | HE | 4.32 | HE | 9 |
| 9. Adaptability to Emerging Technologies | 4.25 | HE | 4.68 | HE | 4.25 | HE | 4.42 | HE | 4.40 | HE | 5 |
| 10. Digital Ethics and Responsibility | 4.27 | HE | 4.75 | HE | 4.35 | HE | 4.55 | HE | 4.48 | HE | 1.5 |
| 11. Data Management Preservation | 4.26 | HE | 4.69 | HE | 4.24 | HE | 4.50 | HE | 4.42 | HE | 4 |
| 12. Digital Survival Skills | 4.23 | HE | 4.59 | HE | 4.16 | E | 4.49 | HE | 4.37 | HE | 7 |
| Grand Mean | 4.24 | HE | 4.63 | HE | 4.19 | E | 4.40 | HE | 4.36 | HE |
Table 19 consolidates the twelve digital aptitude indicators, which together produced a grand mean of 4.36, Highly Evident. Digital communication skills and digital ethics and responsibility tied for first place, each at 4.48, followed by cybersecurity awareness in third place at 4.44. Data management preservation ranked fourth at 4.42, ahead of adaptability to emerging technologies in fifth place at 4.40. Digital literacy ranked sixth at 4.39, followed by digital survival skills in seventh place at 4.37. Use of educational platforms ranked eighth at 4.33, ahead of problem-solving in digital contexts in ninth place at 4.32. Content creation and
curation ranked tenth at 4.25, while instructional technology integration and online classroom management tied for last place, each at 4.24.
Across respondent groups, school heads rated digital aptitudes highest overall, with a grand mean of 4.63, Highly Evident, followed by non-teaching personnel at 4.40 and supervisors at 4.24, both also Highly Evident; teachers rated digital aptitudes lowest, at 4.19, within the Evident range.
This overall Highly Evident rating points to a solid foundation in the skills most critical to teaching and learning in a digital environment — namely, communication, ethics, and cybersecurity — while also showing that instructional technology integration and online classroom management, though still rated positively, remain comparative growth areas.
This is consistent with the MATATAG Curriculum Framework and Guide (Department of Education, 2023), which mandates the integrated teaching of digital literacy and problem-solving skills across all elementary grades. By embedding these competencies early and providing structured guidance for effective technology use, the framework underscores the
importance of equipping educators with the skills needed to deliver interactive, balanced instruction, while prioritizing teacher training in selecting age-appropriate digital content and fostering a culture of media ethics and digital safety — one that, based on these results, appears to be taking hold in the Division's public elementary schools.
Sub-problem No. 2. How do the four groups of respondents assess the Professional Collaboration and Administrative Support as to:
2.1 Shared Vision and Goal Alignment
-
Table 20 captures shared vision and goal alignment as rated Highly Evident overall, earning a composite weighted mean of 4.49, with all ten indicators in the Highly Evident range. Understanding how individual tasks contribute to overall school objectives ranked first at 4.54, followed by participation in meetings and discussions to clarify school goals in second place at 4.53. Awareness of the school's vision, mission, and core objectives and the ability to communicate that vision to colleagues and students tied for third and fourth place, each at 4.51, ahead of contribution
| Indicators | Supervisors | School Heads | Teachers | Non-Teaching Personnels | Composite | Rank | |||||
| WM | VI | WM | VI | WM | VI | WM | VI | WM | VI | ||
| 1. Awareness of the school’s vision, mission, and core objectives. | 4.25 | HE | 4.73 | HE | 4.44 | HE | 4.61 | HE | 4.51 | HE | 3.5 |
| 2. Consistency of personal teaching goals with the school’s strategic priorities. | 4.38 | HE | 4.60 | HE | 4.38 | HE | 4.49 | HE | 4.46 | HE | 8.5 |
| 3. Understanding how individual tasks contribute to overall school objectives. | 4.38 | HE | 4.73 | HE | 4.43 | HE | 4.61 | HE | 4.54 | HE | 1 |
| 4. Participation in meetings and discussions to clarify school goals. | 4.38 | HE | 4.73 | HE | 4.43 | HE | 4.59 | HE | 4.53 | HE | 2 |
| 5. Alignment of classroom strategies with school-wide learning improvement plans. | 4.38 | HE | 4.60 | HE | 4.36 | HE | 4.51 | HE | 4.46 | HE | 8.5 |
| 6. Ability to communicate the school’s vision to colleagues and students. | 4.50 | HE | 4.73 | HE | 4.35 | HE | 4.46 | HE | 4.51 | HE | 3.5 |
| 7. Collaboration with colleagues to achieve common school targets. | 4.38 | HE | 4.67 | HE | 4.31 | HE | 4.44 | HE | 4.45 | HE | 10 |
| 8. Engagement in planning initiatives that reinforce shared goals. | 4.38 | HE | 4.73 | HE | 4.29 | HE | 4.49 | HE | 4.47 | HE | 6.5 |
| 9. Awareness of policy changes and adaptation to align with new school objectives. | 4.25 | HE | 4.73 | HE | 4.35 | HE | 4.56 | HE | 4.47 | HE | 6.5 |
| 10.Contribution to monitoring and evaluating the progress of shared goals. | 4.38 | HE | 4.73 | HE | 4.31 | HE | 4.49 | HE | 4.48 | HE | 5 |
| Overall Weighted Mean | 4.37 | HE | 4.70 | HE | 4.37 | HE | 4.53 | HE | 4.49 | HE |
Legend:
Range Scale Verbal Interpretation Symbol
| 5 | 4.20-5.00 Highly Evident | HE |
| 4 | 3.40-4.19 Evident | E |
| 3 | 2.60-3.39 Moderately Evident | ME |
| 2 | 1.80-2.59 Least Evident | LE |
| 1 | 1.00-1.79 Not Evident | NE |
to monitoring and evaluating shared goals in fifth place at
4.48. Engagement in planning initiatives that reinforce shared goals and awareness of policy changes and adaptation to new objectives tied for sixth and seventh place, each at
4.47. Consistency of personal teaching goals with school priorities and alignment of classroom strategies with school-wide improvement plans tied for eighth and ninth
place, each at 4.46, while collaboration with colleagues to achieve common targets ranked last at 4.45.
-
By respondent group, school heads rated this area highest at 4.70, Highly Evident, followed by non-teaching personnel at 4.53, also Highly Evident; supervisors and teachers rated it identically, at 4.37, also within the Highly Evident range.
-
This strong, shared understanding of the school's vision and goals suggests a genuine collective commitment among personnel, one likely to support more cohesive collaboration and more effective progress toward educational objectives.
-
Brooks and MacPhee (2026) support this reading, emphasizing that shared vision and collegial planning are central to effective teamwork in schools, and arguing that transparent communication and clearly aligned goals build the trust needed to motivate staff to work collectively toward common objectives.
Collaborative Planning and Teamwork
-
Table 21 documents collaborative planning and teamwork as rated Highly Evident overall, earning a composite weighted
| Indicators | Supervisors | School Heads | Teachers | Non-Teaching Personnels | Composite | Rank | |||||
| WM | VI | WM | VI | WM | VI | WM | VI | WM | VI | ||
| 1. Active participation in departmental or grade-level planning sessions. | 4.38 | HE | 4.67 | HE | 4.37 | HE | 4.54 | HE | 4.49 | HE | 1 |
| 2. Sharing instructional materials and resources with colleagues. | 4.13 | E | 4.67 | HE | 4.31 | HE | 4.49 | HE | 4.40 | HE | 5.5 |
| 3. Coordinating schedules and lesson plans to avoid overlaps. | 4.13 | E | 4.60 | HE | 4.31 | HE | 4.49 | HE | 4.38 | HE | 7 |
| 4. Providing constructive feedback to peers during collaborative tasks. | 4.00 | E | 4.60 | HE | 4.26 | HE | 4.41 | HE | 4.32 | HE | 10 |
| 5. Joint development of interdisciplinary or school-wide projects. | 4.00 | E | 4.80 | HE | 4.23 | HE | 4.46 | HE | 4.37 | HE | 8.5 |
| 6. Problem-solving collectively to address classroom or administrative challenges. | 4.00 | E | 4.73 | HE | 4.27 | HE | 4.46 | HE | 4.37 | HE | 8.5 |
| 7. Supporting colleagues during high-demand periods or special projects. | 4.00 | E | 4.80 | HE | 4.30 | HE | 4.49 | HE | 4.40 | HE | 5.5 |
| 8. Communicating openly and effectively within teams. | 4.00 | E | 4.80 | HE | 4.32 | HE | 4.51 | HE | 4.41 | HE | 4 |
| 9. Respecting diverse perspectives and integrating them into planning. | 4.13 | E | 4.80 | HE | 4.29 | HE | 4.49 | HE | 4.43 | HE | 3 |
| 10.Engaging in peer mentoring or co-teaching activities. | 4.13 | E | 4.80 | HE | 4.35 | HE | 4.51 | HE | 4.45 | HE | 2 |
| Overall Weighted Mean | 4.09 | E | 4.73 | HE | 4.30 | HE | 4.49 | HE | 4.40 | HE |
mean of 4.40, with all ten indicators in the Highly Evident range. Active participation in departmental or grade-level planning sessions ranked first at 4.49, followed by engaging in peer mentoring or co-teaching activities in second place at 4.45. Respecting diverse perspectives and integrating them into planning ranked third at 4.43, ahead of communicating openly and effectively within teams in fourth place at 4.41. Sharing instructional materials with colleagues and supporting colleagues during high-demand
periods tied for fifth and sixth place, each at 4.40, followed by coordinating schedules and lesson plans to avoid overlaps in seventh place at 4.38. Joint development of interdisciplinary or school-wide projects and collective problem-solving on classroom or administrative challenges tied for eighth and ninth place, each at 4.37, while providing constructive feedback to peers during collaborative tasks ranked last at 4.32.
-
By respondent group, school heads rated this area highest at 4.73, Highly Evident, followed by non-teaching personnel at 4.49 and teachers at 4.30, both also Highly Evident; supervisors rated it lowest, at 4.09, within the Evident range.
-
This generally strong collaborative culture points to meaningful cooperation and mutual support among school staff, conditions that can improve instructional quality and help schools address challenges more effectively as they arise.
-
Hargreaves and O'Connor (2020) reinforce this interpretation, arguing that authentic professional
collaboration — grounded in mutual trust, shared responsibility, and open communication — is essential to building vibrant learning communities, and noting that schools where staff actively engage in collaborative planning, mentoring, and respect for diverse perspectives tend to see stronger instructional practice and greater organizational resilience.
Instructional Leadership and Supervisory Support
-
Table 22 portrays instructional leadership and supervisory support as rated Highly Evident overall, earning a composite weighted mean of 4.37, with all ten indicators in the Highly Evident range. Recognition of accomplishments and effective practices by school leaders ranked first at 4.42, followed by active involvement of school leaders in fostering a positive teaching and learning environment in second place at 4.41. Timely guidance and feedback from supervisors on instructional practices ranked third at 4.40, ahead of the availability of mentorship or coaching for professional development in fourth place at 4.39. Assistance in aligning lesson plans with curriculum standards and opportunities
| Indicators | Supervisors | School Heads | Teachers | Non-Teaching Personnels | Composite | Rank | |||||
| WM | VI | WM | VI | WM | VI | WM | VI | WM | VI | ||
| 1.Receiving timely guidance and feedback from supervisors on instructional practices. | 4.25 | HE | 4.60 | HE | 4.24 | HE | 4.49 | HE | 4.40 | HE | 3 |
| 2. Supervisorsmonitoring classroom practices to identify strengths and areas for improvement. | 3.75 | E | 4.53 | HE | 4.21 | HE | 4.46 | HE | 4.24 | HE | 10 |
| 3. Encouragement from school heads to innovate and implement effective teaching strategies. | 4.00 | E | 4.67 | HE | 4.28 | HE | 4.51 | HE | 4.37 | HE | 7.5 |
| 4.Availability of mentorship or coachingforprofessional development. | 4.13 | E | 4.67 | HE | 4.25 | HE | 4.51 | HE | 4.39 | HE | 4 |
| 5.Assistance in aligning lesson planswithcurriculum standards. | 4.13 | E | 4.67 | HE | 4.28 | HE | 4.44 | HE | 4.38 | HE | 5.5 |
| 6.Opportunities for professional growth through workshops, seminars, and training. | 4.00 | E | 4.73 | HE | 4.31 | HE | 4.49 | HE | 4.38 | HE | 5.5 |
| 7. Recognitionof accomplishments and effective practices by school leaders. | 4.13 | E | 4.73 | HE | 4.31 | HE | 4.49 | HE | 4.42 | HE | 1 |
| 8.Support in resolving classroom or student-related challenges. | 4.00 | E | 4.67 | HE | 4.28 | HE | 4.46 | HE | 4.35 | HE | 9 |
| 9. Clear communication of school policies and expectations by supervisory staff. | 4.00 | E | 4.73 | HE | 4.30 | HE | 4.44 | HE | 4.37 | HE | 7.5 |
| 10. Active involvement of school leaders in facilitating a positive teaching and learning environment. | 4.13 | E | 4.73 | HE | 4.31 | HE | 4.46 | HE | 4.41 | HE | 2 |
| Overall Weighted Mean | 4.05 | E | 4.67 | HE | 4.28 | HE | 4.48 | HE | 4.37 | HE |
for professional growth through workshops and training tied for fifth and sixth place, each at 4.38. Encouragement from school heads to innovate and clear communication of
school policies and expectations tied for seventh and eighth place, each at 4.37, ahead of support in resolving classroom or student-related challenges in ninth place at
4.35. Supervisors monitoring classroom practices to identify strengths and areas for improvement ranked last at 4.24.
-
By respondent group, school heads rated this area highest at 4.67, Highly Evident, followed by non-teaching personnel at 4.48 and teachers at 4.28, both also Highly Evident; supervisors rated it lowest, at 4.05, within the Evident range.
-
The generally strong ratings for instructional leadership and supervisory support point to consistent encouragement, mentorship, and recognition from school leaders — conditions that support a more positive teaching and learning environment overall.
-
Villanueva and Corpuz (2026) found a similar pattern, reporting that effective instructional leadership — marked by timely feedback, mentorship, and recognition — positively shapes teacher motivation and professional growth, and that
clear communication and active supervisory involvement help build the collaborative, supportive climate needed for stronger instructional quality.
Communication and Decision-Making Support
| Indicators | Supervisors | School Heads | Teachers | Non-Teaching Personnels | Composite | Rank | |||||
| WM | VI | WM | VI | WM | VI | WM | VI | WM | VI | ||
| 1. Clear dissemination of important school announcements and policies. | 4.38 | HE | 4.80 | HE | 4.34 | HE | 4.46 | HE | 4.50 | HE | 2 |
| 2. Opportunities to participate in decision-making processes related to instruction or administration. | 4.25 | HE | 4.80 | HE | 4.32 | HE | 4.49 | HE | 4.47 | HE | 5.5 |
| 3. Timely communication of changes in schedules,curriculum,or administrative requirements. | 4.25 | HE | 4.80 | HE | 4.34 | HE | 4.56 | HE | 4.49 | HE | 3 |
| 4. Encouragement to express ideas and suggestions freely. | 4.25 | HE | 4.73 | HE | 4.34 | HE | 4.54 | HE | 4.47 | HE | 5.5 |
| 5. Efficient use of meetings, memos, and digital platforms for school communication. | 4.38 | HE | 4.80 | HE | 4.36 | HE | 4.56 | HE | 4.53 | HE | 1 |
| 6. Support from supervisors when making instructional or classroom decisions. | 4.13 | E | 4.60 | HE | 4.28 | HE | 4.51 | HE | 4.38 | HE | 9.5 |
| 7. Accessibility of school leaders for consultation on work-related issues. | 4.13 | E | 4.53 | HE | 4.30 | HE | 4.56 | HE | 4.38 | HE | 9.5 |
| 8. Clarity of role expectations in decision-making processes. | 4.25 | HE | 4.60 | HE | 4.31 | HE | 4.56 | HE | 4.43 | HE | 7 |
| 9. Transparency in the implementation of school policies and initiatives. | 4.25 | HE | 4.73 | HE | 4.34 | HE | 4.59 | HE | 4.48 | HE | 4 |
| 10.Feedback mechanisms that allow teachers and staff to voice concerns or propose improvements. | 4.00 | E | 4.67 | HE | 4.32 | HE | 4.61 | HE | 4.40 | HE | 8 |
| Overall Weighted Mean | 4.23 | HE | 4.71 | HE | 4.33 | HE | 4.54 | HE | 4.45 | HE |
-
Table 23 sets out communication and decision-making support as rated Highly Evident overall, earning a composite weighted mean of 4.45, with all ten indicators in the Highly
Evident range. Efficient use of meetings, memos, and digital platforms for school communication ranked first at 4.53, followed by clear dissemination of important school announcements and policies in second place at 4.50. Timely communication of changes in schedules, curriculum, or administrative requirements ranked third at 4.49, ahead of transparency in the implementation of school policies and initiatives in fourth place at 4.48. Opportunities to participate in decision-making and encouragement to express ideas freely tied for fifth and sixth place, each at 4.47, followed by clarity of role expectations in decision-making in seventh place at 4.43. Feedback mechanisms allowing staff to voice concerns or propose improvements ranked eighth at 4.40, while support from supervisors on instructional decisions and accessibility of school leaders for consultation tied for last place, each at 4.38.
-
By respondent group, school heads rated this area highest at 4.71, Highly Evident, followed by non-teaching personnel at 4.54, teachers at 4.33, and supervisors at 4.23 — all within the Highly Evident range.
-
These results point to effective information flow and inclusive participation among school personnel, supporting transparency and collaborative problem-solving. The particularly strong ratings from school heads and non-teaching personnel underscore their central role in enabling clear communication and shared decision-making.
-
Schneider and Vogel (2025) reach a similar conclusion, finding that clear, timely communication and participatory decision-making are fundamental to effective instructional leadership, and that when school leaders prioritize transparent information-sharing and involve staff in decisions, trust and collaboration improve, ultimately supporting better educational outcomes.
Recognition, Motivation, and Well-Being Support
Table 24 conveys recognition, motivation, and well-being support as rated Highly Evident overall, earning a composite weighted mean of 4.38, with all ten indicators in the Highly Evident range. Encouragement of professional growth through training and skill development ranked first at 4.45, followed by promotion of work-life balance among teaching and non-
| Indicators | Supervisors | School Heads | Teachers | Non-Teaching Personnels | Composite | Rank | |||||
| WM | VI | WM | VI | WM | VI | WM | VI | WM | VI | ||
| 1.Regular acknowledgment of teacher and staff achievements. | 4.25 | HE | 4.67 | HE | 4.26 | HE | 4.51 | HE | 4.42 | HE | 3 |
| 2.Provision of incentives or awards for exceptional performance. | 4.13 | E | 4.73 | HE | 4.18 | E | 4.44 | HE | 4.37 | HE | 7.5 |
| 3. Emotionalsupportand encouragement during challenging teaching periods. | 4.13 | E | 4.80 | HE | 4.18 | E | 4.39 | HE | 4.38 | HE | 6 |
| 4.Promotion of work-life balance among teaching and non-teaching personnel. | 4.38 | HE | 4.80 | HE | 4.16 | E | 4.37 | HE | 4.43 | HE | 2 |
| 5.Availability of programs to enhance teacher well-being (e.g., wellness seminars, counseling). | 3.88 | E | 4.73 | HE | 4.17 | E | 4.41 | HE | 4.30 | HE | 10 |
| 6.Positive reinforcement for innovative and effective teaching practices. | 4.13 | E | 4.67 | HE | 4.25 | HE | 4.44 | HE | 4.37 | HE | 7.5 |
| 7.Recognition of contributions to collaborativeandschool-wide initiatives. | 3.88 | E | 4.67 | HE | 4.22 | HE | 4.49 | HE | 4.32 | HE | 9 |
| 8.Supportive work environment that fostersmotivationandjob satisfaction. | 4.13 | E | 4.73 | HE | 4.24 | HE | 4.46 | HE | 4.39 | HE | 5 |
| 9.Encouragementofprofessional growth through training and skill development. | 4.25 | HE | 4.73 | HE | 4.26 | HE | 4.54 | HE | 4.45 | HE | 1 |
| 10. Implementation of policies and practices that reduce stress and enhance teacher morale. | 4.13 | E | 4.73 | HE | 4.23 | HE | 4.49 | HE | 4.40 | HE | 4 |
| Overall Weighted Mean | 4.13 | E | 4.73 | HE | 4.22 | HE | 4.45 | HE | 4.38 | HE |
teaching personnel in second place at 4.43. Regular acknowledgment of teacher and staff achievements ranked third at 4.42, ahead of implementation of policies that reduce stress and enhance morale in fourth place at 4.40. A supportive work environment that fosters motivation and job satisfaction ranked fifth at 4.39, followed by emotional support during challenging teaching periods in sixth place at 4.38. Provision
of incentives for exceptional performance and positive reinforcement for innovative teaching practices tied for seventh and eighth place, each at 4.37, ahead of recognition of contributions to collaborative and school-wide initiatives in ninth place at 4.32. Availability of well-being programs such as wellness seminars or counseling ranked last at 4.30.
By respondent group, school heads rated this area highest at 4.73, Highly Evident, followed by non-teaching personnel at
4.45 and teachers at 4.22, both also Highly Evident; supervisors rated it lowest, at 4.13, within the Evident range. These results reflect a clear commitment from school leaders to fostering a supportive work environment that encourages professional growth and work-life balance for
staff.
Henderson and Wallace (2024) found a comparable pattern, reporting that authentic recognition combined with emotional support and well-being initiatives significantly improves teacher motivation and retention, and that structured encouragement paired with stress-reduction policies fosters a healthier workplace climate that ultimately supports
professional fulfillment and sustained engagement.
| Criteria | Supervisors | School Heads | Teachers | Non-Teaching Personnels | Composite | Rank | |||||
| WM | VI | WM | VI | WM | VI | WM | VI | WM | VI | ||
| 1.Shared Vision and Goal Alignment | 4.37 | HE | 4.70 | HE | 4.37 | HE | 4.53 | HE | 4.49 | HE | 1 |
| 2.Collaborative Planning and Teamwork | 4.09 | E | 4.73 | HE | 4.30 | HE | 4.49 | HE | 4.40 | HE | 3 |
| 3.InstructionalLeadership and Supervisory Support | 4.05 | E | 4.67 | HE | 4.28 | HE | 4.48 | HE | 4.37 | HE | 5 |
| 4.Communicationand Decision-Making Support | 4.23 | HE | 4.71 | HE | 4.33 | HE | 4.54 | HE | 4.45 | HE | 2 |
| 5.Recognition,Motivation, and Well-Being Support | 4.13 | E | 4.73 | HE | 4.22 | HE | 4.45 | HE | 4.38 | HE | 4 |
| Grand Mean | 4.17 | E | 4.71 | HE | 4.30 | HE | 4.50 | HE | 4.42 | HE |
Table 25 draws together the five indicators of professional collaboration and administrative support, which together produced a grand mean of 4.42, Highly Evident. Shared vision and goal alignment ranked first at 4.49, followed by communication and decision-making support in second place at
4.45. Collaborative planning and teamwork ranked third at 4.40, ahead of recognition, motivation, and well-being support in fourth place at 4.38, while instructional leadership and supervisory support ranked last at 4.37.
By respondent group, school heads rated professional collaboration and administrative support highest overall, with
a grand mean of 4.71, Highly Evident, followed by non-teaching personnel at 4.50 and teachers at 4.30, both also Highly Evident; supervisors rated it lowest, at 4.17, within the Evident range.
Taken together, these results indicate that professional collaboration and administrative support are well established in public elementary schools in the Division, anchored especially in a shared institutional vision, effective communication, and consistent teamwork that collectively drive school improvement.
This is consistent with recent work on distributed leadership by Heikka (2025), who found that schools achieve stronger performance when leadership is treated as a shared, community-wide responsibility rather than a top-down mandate
— a principle reflected in how supervisors, school heads, teachers, and non-teaching personnel in this study collectively sustain a collaborative and well-functioning school environment.
Sub-problem No. 3. Is there a significant difference among the assessments of the four groups of respondents as to the
abovementioned variables?
Table 26 sets out a comparative assessment of digital aptitudes among the four groups of respondents in public elementary schools — supervisors, school heads, teachers, and non-teaching personnel — across twelve areas of concern. The computed F-values for every area were well below the critical value of 2.87 at 3 and 36 degrees of freedom, at the 0.05 level of significance: digital literacy yielded an F-value of 0.03425, instructional technology integration 0.04600, online classroom management 0.04680, content creation and curation 0.03677, cybersecurity awareness 0.03389, digital communication skills 0.03420, use of educational platforms 0.04110, problem-solving in digital contexts 0.06505, adaptability to emerging technologies 0.03737, digital ethics and responsibility 0.04263, data management preservation 0.04176, and digital survival skills 0.03846. None of these values approached the critical threshold, indicating that no statistically significant differences exist in digital aptitudes among the four groups across all twelve areas assessed.
This suggests that digital skills are relatively uniform across roles within public elementary schools, pointing to a consistent baseline of digital competence regardless of position.
This finding aligns with the empirical work of Alastor et al. (2025), who found that comprehensive digital transformation in public education narrows disparities in technical skill across organizational levels considerably. Their research shows that systemic integration of this kind fosters an evenly distributed baseline of proficiency among administrators, teachers, and support staff, which helps explain why supervisors, school heads, teachers, and non-teaching personnel in this study report comparable competencies in core digital areas such as literacy, communication, and data management — evidence that this school division has succeeded in developing a fairly unified level of digital capability across roles.
Table 27 sets out a comparative assessment of professional collaboration and administrative support among the same four respondent groups across five areas of concern.
| Areas of Concern | SS | MSS | df | F-value | Critical Value | Interpretation | Decision | |
| 1. Digital Literacy | Bet. Grp Within | 0.114 40.05 | 0.038 1.112 | 3 36 | 0.03425 | 2.87 | Not Significant | Failed to Reject Ho |
| Grp. | ||||||||
| 2. Instructional Technology Integration | Bet. Grp Within Grp. | 0.153 40.03 | 0.051 1.111 | 3 36 | 0.04600 | 2.87 | Not Significant | Failed to Reject Ho |
| 3. OnlineClassroom | Bet. Grp | 0.156 | 0.052 | 3 | 0.04680 | 2.87 | Not Significant | Failed to |
| 40.01 | 1.111 | 36 | Reject Ho | |||||
| Within Grp. | ||||||||
| Management | ||||||||
| 4. Content Creation and Curation | Bet. Grp Within Grp. | 0.122 40.01 | 0.040 1.111 | 3 36 | 0.03677 | 2.87 | Not Significant | Failed to Reject Ho |
| 5. Cybersecurity | Bet. Grp | 0.113 | 0.037 | 3 | 0.03389 | 2.87 | Not Significant | Failed to |
| 40.02 | 1.111 | 36 | Reject Ho | |||||
| Within Grp. | ||||||||
| Awareness | ||||||||
| 6. Digital Communication Skills | Bet. Grp Within Grp. | 0.114 40.00 | 0.038 1.111 | 3 36 | 0.03420 | 2.87 | Not Significant | Failed to Reject Ho |
| 7. UseofEducational | Bet. Grp | 0.137 | 0.045 | 3 | 0.04110 | 2.87 | Not Significant | Failed to |
| 40.00 | 1.111 | 36 | Reject Ho | |||||
| Within Grp. | ||||||||
| Platforms | ||||||||
| 8. Problem-Solvingin Digital Contexts | Bet. Grp Within Grp. | 0.216 40.00 | 0.072 1.111 | 3 36 | 0.06505 | 2.87 | Not Significant | Failed to Reject Ho |
| 9. Adaptability to Emerging | Bet. Grp | 0.124 | 0.041 | 3 | 0.03737 | 2.87 | Not Significant | Failed to |
| 40.00 | 1.111 | 36 | Reject Ho | |||||
| Within Grp. | ||||||||
| Technologies | ||||||||
| 10. DigitalEthicsand Responsibility | Bet. Grp Within Grp. | 0.142 40.00 | 0.047 1.111 | 3 36 | 0.04263 | 2.87 | Not Significant | Failed to Reject Ho |
| 11. DataManagement | Bet. Grp | 0.139 | 0.046 | 3 | 0.04176 | 2.87 | Not Significant | Failed to |
| 40.01 | 1.111 | 36 | Reject Ho | |||||
| Within Grp. | ||||||||
| Preservation | ||||||||
| 12. Data Survival Skills | Bet. Grp Within | 0.128 40.00 | 0.042 1.111 | 3 36 | 0.03846 | 2.87 | Not Significant | Failed to Reject Ho |
| Grp. |
Level of Significance: 0.05
As with digital aptitudes, every computed F-value fell below the critical value of 2.87 at 3 and 36 degrees of freedom and the 0.05 level of significance: shared vision and goal
| Areas of Concern | SS | MSS | df | F-value | Critical Value | Interpretation | Decision | |
| 1.Shared Vision and Goal Alignment | Bet. Grp Within Grp. | 0.075 40.00 | 0.025 1.111 | 3 36 | 0.02264 | 2.87 | Not Significant | Failed to Reject Ho |
| 2. Collaborative Planningand Teamwork | Bet. Grp Within Grp. | 0.220 40.01 | 0.073 1.111 | 3 36 | 0.06600 | 2.87 | Not Significant | Failed to Reject Ho |
| 3. Instructional Leadershipand Supervisory Support | Bet. Grp Within Grp. | 0.212 40.01 | 0.070 1.111 | 3 36 | 0.06376 | 2.87 | Not Significant | Failed to Reject Ho |
| 4. Communication and Decision-Making Support | Bet. Grp Within Grp. | 0.139 40.01 | 0.046 1.111 | 3 36 | 0.04190 | 2.87 | Not Significant | Failed to Reject Ho |
| 5. Recognition, Motivation, and Well-Being Support | Bet. Grp Within Grp. | 0.215 40.01 | 0.071 1.111 | 3 36 | 0.06460 | 2.87 | Not Significant | Failed to Reject Ho |
Level of Significance: 0.05
alignment yielded an F-value of 0.02264, collaborative planning and teamwork 0.06600, instructional leadership and supervisory support 0.06376, communication and decision-making support 0.04190, and recognition, motivation, and well-being support 0.06460 — indicating no statistically significant differences among the groups on any of the five indicators.
This implies that perceptions of professional collaboration and administrative support are fairly consistent across supervisors, school heads, teachers, and non-teaching personnel, pointing to a shared experience of these factors within the public elementary school context.
This uniform consensus is echoed by García-Martínez et al.
(2023), who found that distributed leadership frameworks paired with strong internal communication foster a more homogeneous organizational climate within schools. Their research shows that when administrative support and collaborative goals are embedded into a school's operational culture, the perceptions of institutional actors tend to align regardless of hierarchical position — consistent with the unified consensus on leadership effectiveness observed across all four respondent groups in this study, and with the absence of meaningful perceptual gaps between teaching, non-teaching, and supervisory personnel.
Sub-problem No. 4. What is the Level of Teachers’ Fulfillment as to:
20.1 Instructional Delivery and Classroom Management
-
Table 28 sets out the level of teachers' fulfillment in instructional delivery and classroom management as Highly Fulfilled overall, earning a composite weighted mean of
4.31. All ten indicators fell in the Highly Fulfilled range.
Incorporation of instructional materials and resources to
enhance learning ranked first at 4.34, followed by timely
| Indicators | Supervisors | School Heads | Teachers | Non-Teaching Personnels | Composite | Rank | |||||
| WM | VI | WM | VI | WM | VI | WM | VI | WM | VI | ||
| 1.Clarity and organization of lesson presentations. | 4.00 | F | 4.67 | HF | 4.22 | HF | 4.29 | HF | 4.30 | HF | 8 |
| 2.Ability to maintain a positive and conducive classroom environment. | 4.13 | F | 4.67 | HF | 4.18 | F | 4.27 | HF | 4.31 | HF | 5.33 |
| 3. Effectiveness in managing classroom rules and student behavior. | 4.00 | F | 4.67 | HF | 4.21 | HF | 4.27 | HF | 4.29 | HF | 9 |
| 4. Use of diverse teaching strategies to meet different learner needs. | 4.00 | F | 4.67 | HF | 4.23 | HF | 4.32 | HF | 4.31 | HF | 5.33 |
| 5.Timely delivery of lessons according to the curriculum plan. | 4.00 | F | 4.67 | HF | 4.26 | HF | 4.37 | HF | 4.33 | HF | 2.5 |
| 6.Incorporation of instructional materials and resources to enhance learning. | 4.00 | F | 4.67 | HF | 4.29 | HF | 4.41 | HF | 4.34 | HF | 1 |
| 7. Responsiveness to students’ questions and learning difficulties. | 4.00 | F | 4.60 | HF | 4.25 | HF | 4.37 | HF | 4.31 | HF | 5.33 |
| 8. Implementation of innovative teaching methods and activities. | 4.00 | F | 4.60 | HF | 4.20 | HF | 4.32 | HF | 4.28 | HF | 10 |
| 9.Monitoringandadjusting instruction based on student progress. | 4.00 | F | 4.60 | HF | 4.29 | HF | 4.44 | HF | 4.33 | HF | 2.5 |
| 10. Maintaining consistency in classroomroutinesand expectations. | 4.00 | F | 4.67 | HF | 4.24 | HF | 4.37 | HF | 4.32 | HF | 4 |
| Overall Weighted Mean | 4.01 | F | 4.65 | HF | 4.24 | HF | 4.34 | HF | 4.31 | HF | |
| Legend: | Range | Scale | Verbal Interpretation | Symbol | |||||||
| 5 | 4.20-5.00 | Highly Fulfilled | HF | ||||||||
| 4 | 3.40-4.19 | Fulfilled | F | ||||||||
| 3 | 2.60-3.39 | Moderately Fulfilled | MF | ||||||||
| 2 | 1.80-2.59 | Least Fulfilled | LF | ||||||||
| 1 | 1.00-1.79 | Not Fulfilled | NF |
delivery of lessons according to the curriculum plan and monitoring and adjusting instruction based on student progress, which tied for second and third place, each at
4.33. Maintaining consistency in classroom routines and expectations ranked fourth at 4.32, ahead of the ability to maintain a positive and conducive classroom environment, the use of diverse teaching strategies to meet different learner needs, and responsiveness to students' questions and learning difficulties, which tied for fifth through seventh place, each at 4.31. Clarity and organization of lesson presentations ranked eighth at 4.30, followed by effectiveness in managing classroom rules and student behavior in ninth place at 4.29, while implementation of innovative teaching methods and activities ranked last at 4.28.
-
By respondent group, school heads rated this area highest at 4.65, Highly Fulfilled, followed by non-teaching personnel at 4.34 and teachers at 4.24, both also Highly Fulfilled; supervisors rated it lowest, at 4.01, within the Fulfilled range.
-
This consistently high level of fulfillment across all four groups reflects positively on teaching effectiveness and classroom dynamics, suggesting that a stable and supportive learning environment is being maintained.
-
This finding aligns closely with Marasigan and Sorbeto (2025), who found a strong positive relationship between the use of student-centered activities, comprehensive instructional resource support, and teacher job satisfaction and engagement. Their study shows that giving educators the tools to diversify their teaching approaches and sustain effective classroom routines meaningfully reduces burnout and enhances professional fulfillment, consistent with the high fulfillment ratings observed across all respondent groups here — particularly among school heads and non-teaching personnel.
Learner Engagement and Achievement
-
Table 29 presents the level of teachers' fulfillment in learner engagement and achievement as Highly Fulfilled overall, earning a composite weighted mean of 4.34. All ten indicators fell in the Highly Fulfilled range.
| Indicators | Supervisors | School Heads | Teachers | Non-Teaching Personnels | Composite | Rank | |||||
| WM | VI | WM | VI | WM | VI | WM | VI | WM | VI | ||
| 1.Ability to motivate students to actively participate in lessons. | 4.00 | F | 4.47 | HF | 4.26 | HF | 4.39 | HF | 4.28 | HF | 8.5 |
| 2.Encouragementofcritical thinking and problem-solving among students. | 4.00 | F | 4.47 | HF | 4.24 | HF | 4.37 | HF | 4.27 | HF | 10 |
| 3. Use of interactive activities to enhancelearner engagement. | 4.00 | F | 4.47 | HF | 4.24 | HF | 4.39 | HF | 4.28 | HF | 8.5 |
| 4.Monitoring student progress and providing support to struggling learners. | 4.13 | F | 4.67 | HF | 4.32 | HF | 4.46 | HF | 4.40 | HF | 1.5 |
| 5.Recognition and celebration of student achievements. | 4.13 | F | 4.67 | HF | 4.31 | HF | 4.46 | HF | 4.39 | HF | 3 |
| 6. Promotingcollaborative learningandpeer interactions. | 4.13 | F | 4.67 | HF | 4.28 | HF | 4.41 | HF | 4.37 | HF | 4 |
| 7. Connecting lessons to real-life applications to increase student interest. | 4.00 | F | 4.67 | HF | 4.31 | HF | 4.41 | HF | 4.35 | HF | 5 |
| 8.Using formative feedback to improve student performance. | 4.13 | F | 4.60 | HF | 4.33 | HF | 4.54 | HF | 4.40 | HF | 1.5 |
| 9. Encouraging independent learning and responsibility among students. | 4.00 | F | 4.60 | HF | 4.28 | HF | 4.39 | HF | 4.32 | HF | 7 |
| 10. Adjusting teaching methods to maximizestudent participationand understanding. | 4.00 | F | 4.60 | HF | 4.30 | HF | 4.46 | HF | 4.34 | HF | 6 |
| Overall Weighted Mean | 4.05 | F | 4.59 | HF | 4.29 | HF | 4.43 | HF | 4.34 | HF |
Monitoring student progress and providing support to struggling learners and using formative feedback to improve student performance tied for first place, each at 4.40, followed by recognition and celebration of student
achievements in third place at 4.39. Promoting collaborative learning and peer interactions ranked fourth at 4.37, ahead of connecting lessons to real-life applications to increase student interest in fifth place at 4.35. Adjusting teaching methods to maximize student participation and understanding ranked sixth at 4.34, followed by encouraging independent learning and responsibility among students in seventh place at 4.32. The ability to motivate students to actively participate in lessons and the use of interactive activities to enhance learner engagement tied for eighth and ninth place, each at 4.28, while encouragement of critical thinking and problem-solving among students ranked last at 4.27.
-
By respondent group, school heads rated this area highest at 4.59, Highly Fulfilled, followed by non-teaching personnel at 4.43 and teachers at 4.29, both also Highly Fulfilled; supervisors rated it lowest, at 4.05, within the Fulfilled range.
-
This uniformly strong fulfillment rating reflects positively on the effectiveness of instructional practices,
suggesting that students experience engaged learning environments that support their academic progress and overall achievement.
-
This finding is supported by Williamson and Thorne (2024), whose research on classroom engagement and assessment strategies demonstrates that when educators actively use continuous formative assessment and structured progress monitoring, student learning outcomes and classroom participation improve significantly. Their study emphasizes that the dynamic of delivering targeted feedback and intervening to support struggling learners creates a rewarding loop for teachers, contributing substantially to their professional satisfaction and fulfillment.
Assessment and Feedback Practices
-
Table 30 documents the level of teachers' fulfillment in assessment and feedback practices as Highly Fulfilled overall, earning a composite weighted mean of 4.36. All ten
indicators fell in the Highly Fulfilled range. Tracking students' progress over time for continuous improvement and using assessment to
| Indicators | Supervisors | School Heads | Teachers | Non-Teaching Personnels | Composite | Rank | |||||
| WM | VI | WM | VI | WM | VI | WM | VI | WM | VI | ||
| 1. Design and implementation of variedassessmentmethods (tests, projects, portfolios). | 3.88 | F | 4.67 | HF | 4.27 | HF | 4.44 | HF | 4.32 | HF | 8.5 |
| 2. Timelyandconstructive feedbackonstudent performance. | 4.00 | F | 4.67 | HF | 4.30 | HF | 4.46 | HF | 4.36 | HF | 7 |
| 3. Use of assessment results to guide instructional planning. | 4.13 | F | 4.67 | HF | 4.30 | HF | 4.44 | HF | 4.39 | HF | 3.5 |
| 4. Alignment of assessments with learningobjectivesand standards. | 4.00 | F | 4.67 | HF | 4.25 | HF | 4.37 | HF | 4.32 | HF | 8.5 |
| 5. Encouragement of student self-assessment and reflection. | 3.88 | F | 4.67 | HF | 4.25 | HF | 4.39 | HF | 4.30 | HF | 10 |
| 6. Fairandobjectivegrading practices. | 4.13 | F | 4.73 | HF | 4.28 | HF | 4.39 | HF | 4.38 | HF | 5 |
| 7. Tracking students’ progress over time for continuous improvement. | 4.13 | F | 4.73 | HF | 4.31 | HF | 4.46 | HF | 4.41 | HF | 1.5 |
| 8. Communicatingassessment results effectively to students and parents. | 4.13 | F | 4.60 | HF | 4.32 | HF | 4.49 | HF | 4.39 | HF | 3.5 |
| 9. Integrating technology to enhance assessment and feedbackprocesses.by supervisory staff. | 4.00 | F | 4.67 | HF | 4.30 | HF | 4.49 | HF | 4.37 | HF | 6 |
| 10.Using assessment to identify strengths, weaknesses, and learning gaps. | 4.13 | F | 4.67 | HF | 4.33 | HF | 4.51 | HF | 4.41 | HF | 1.5 |
| Overall Weighted Mean | 4.04 | F | 4.68 | HF | 4.29 | HF | 4.44 | HF | 4.36 | HF |
identify strengths, weaknesses, and learning gaps tied for first place, each at 4.41, followed by using assessment results to guide instructional planning and communicating assessment results effectively to students and parents, which tied for third and fourth place, each at 4.39. Fair
and objective grading practices ranked fifth at 4.38, ahead of integrating technology to enhance assessment and feedback processes in sixth place at 4.37. Timely and constructive feedback on student performance ranked seventh at 4.36, followed by the design and implementation of varied assessment methods, such as tests, projects, and portfolios, and the alignment of assessments with learning objectives and standards, which tied for eighth and ninth place, each at 4.32. Encouragement of student self-assessment and reflection ranked last at 4.30.
-
By respondent group, school heads rated this area highest at 4.68, Highly Fulfilled, followed by non-teaching personnel at 4.44 and teachers at 4.29, both also Highly Fulfilled; supervisors rated it lowest, at 4.04, within the Fulfilled range.
-
These strong fulfillment ratings indicate that effective assessment strategies are in place, supporting continuous student improvement and transparent communication with learners and parents.
-
This finding is supported by Blackmore and Harrison (2024), whose research on formative assessment practices establishes that systematic progress monitoring and diagnostic assessment are critical to helping educators pinpoint specific learning barriers and curriculum gaps. Their study shows that schools that actively use diagnostic and longitudinal student tracking tools see gains in pedagogical precision and a corresponding rise in teachers' sense of professional efficacy and institutional fulfillment.
Professional Growth and Accountability
Table 31 portrays the level of teachers' fulfillment in professional growth and accountability as Highly Fulfilled overall, earning a composite weighted mean of 4.40. All ten indicators fell in the Highly Fulfilled range. Willingness to learn new teaching strategies and integrate innovations ranked first at 4.50, followed by participation in professional development activities and training and seeking feedback from supervisors and colleagues for improvement, which tied for second and third place, each at 4.46.
| Indicators | Supervisors | School Heads | Teachers | Non-Teaching Personnels | Composite | Rank | |||||
| WM | VI | WM | VI | WM | VI | WM | VI | WM | VI | ||
| 1.Participation in professional development activities and training. | 4.25 | HF | 4.73 | HF | 4.34 | HF | 4.51 | HF | 4.46 | HF | 2.5 |
| 2.Willingness to learn new teachingstrategiesand integrate innovations. | 4.25 | HF | 4.73 | HF | 4.42 | HF | 4.61 | HF | 4.50 | HF | 1 |
| 3. Commitment to fulfilling assignedteaching responsibilities. | 4.00 | F | 4.73 | HF | 4.38 | HF | 4.56 | HF | 4.42 | HF | 4 |
| 4.Maintaining accurate and organizedinstructional records. | 4.00 | F | 4.67 | HF | 4.33 | HF | 4.54 | HF | 4.39 | HF | 7 |
| 5.Seekingfeedbackfrom supervisors and colleagues for improvement. | 4.25 | HF | 4.60 | HF | 4.38 | HF | 4.59 | HF | 4.46 | HF | 2.5 |
| 6.Engaginginreflective practicestoenhance teaching effectiveness. | 4.00 | F | 4.67 | HF | 4.31 | HF | 4.46 | HF | 4.36 | HF | 8 |
| 7.Active involvement in school improvement initiatives. | 4.13 | F | 4.80 | HF | 4.27 | HF | 4.39 | HF | 4.40 | HF | 5.5 |
| 8.Demonstrating ethical and responsibleprofessional behavior. | 4.00 | F | 4.80 | HF | 4.32 | HF | 4.46 | HF | 4.40 | HF | 5.5 |
| 9.Taking initiative to address classroomandschool challenges. | 4.00 | F | 4.67 | HF | 4.25 | HF | 4.41 | HF | 4.33 | HF | 10 |
| 10. Maintaining accountability for student learning outcomes. | 4.00 | F | 4.67 | HF | 4.28 | HF | 4.39 | HF | 4.34 | HF | 9 |
| Overall Weighted Mean | 4.09 | F | 4.71 | HF | 4.33 | HF | 4.49 | HF | 4.40 | HF |
Commitment to fulfilling assigned teaching responsibilities ranked fourth at 4.42, ahead of active involvement in school improvement initiatives and demonstrating ethical and responsible professional behavior, which tied for fifth and sixth place, each at 4.40. Maintaining accurate and organized
instructional records ranked seventh at 4.39, followed by engaging in reflective practices to enhance teaching effectiveness in eighth place at 4.36. Maintaining accountability for student learning outcomes ranked ninth at 4.34, while taking initiative to address classroom and school challenges ranked last at 4.33.
By respondent group, school heads rated this area highest at 4.71, Highly Fulfilled, followed by non-teaching personnel at 4.49 and teachers at 4.33, both also Highly Fulfilled; supervisors rated it lowest, at 4.09, within the Fulfilled range.
These uniformly high ratings demonstrate a strong commitment to continuous improvement and responsible professional conduct, suggesting that these factors contribute positively to overall teaching effectiveness and school development.
This strong focus on continuous improvement is supported by Darling-Hammond et al. (2023), who found that sustainable professional growth is most effective when teachers actively engage in self-directed learning, collaborative peer
interaction, and the integration of innovative pedagogical practices. Their study shows that a proactive attitude toward new teaching strategies, paired with a systematic approach to seeking and applying constructive feedback, meaningfully reduces burnout and enhances teachers' sense of professional fulfillment.
Community and Stakeholder Involvement
Table 32 conveys the level of teachers' fulfillment in community and stakeholder involvement as Highly Fulfilled overall, earning a composite weighted mean of 4.33. All ten indicators fell in the Highly Fulfilled range. Participation in school-based community programs and activities ranked first at 4.42, followed by collaboration with parents to support student learning, engaging local stakeholders to enhance educational programs, and supporting programs that promote school-community relations, which tied for second through fourth place, each at 4.40. Encouraging students' participation in community initiatives ranked fifth at 4.33, ahead of communicating effectively with community and stakeholders
| Indicators | Supervisors | School Heads | Teachers | Non-Teaching Personnels | Composite | Rank | |||||
| WM | VI | WM | VI | WM | VI | WM | VI | WM | VI | ||
| 1.Participation in school-based communityprogramsand activities. | 4.13 | F | 4.73 | HF | 4.29 | HF | 4.51 | HF | 4.42 | HF | 1 |
| 2.Collaboration with parents to support student learning. | 4.13 | F | 4.73 | HF | 4.31 | HF | 4.44 | HF | 4.40 | HF | 2.33 |
| 3. Engaging local stakeholders to enhance educational programs. | 4.13 | F | 4.73 | HF | 4.27 | HF | 4.46 | HF | 4.40 | HF | 2.33 |
| 4.Organizing or participating in outreachandextension projects. | 3.75 | F | 4.67 | HF | 4.17 | F | 4.37 | HF | 4.24 | HF | 10 |
| 5.Incorporatingcommunity resourcesintoclassroom learning. | 3.75 | F | 4.67 | HF | 4.21 | HF | 4.44 | HF | 4.27 | HF | 9 |
| 6.Buildingpartnershipswith otherschoolsor organizations. | 4.00 | F | 4.67 | HF | 4.14 | F | 4.34 | HF | 4.29 | HF | 7 |
| 7.Encouragingstudents’ participation in community initiatives. | 3.88 | F | 4.73 | HF | 4.26 | HF | 4.44 | HF | 4.33 | HF | 5 |
| 8. Communicating effectively with community and stakeholdersregarding student progress. | 3.88 | F | 4.73 | HF | 4.24 | HF | 4.41 | HF | 4.32 | HF | 6 |
| 9. Advocating for the welfare and needs of students in community settings. | 3.88 | F | 4.67 | HF | 4.18 | F | 4.37 | HF | 4.28 | HF | 8 |
| 10. Supportingprogramsthat promoteschool-community relations. | 4.13 | F | 4.80 | HF | 4.26 | HF | 4.41 | HF | 4.40 | HF | 2.33 |
| Overall Weighted Mean | 3.97 | F | 4.71 | HF | 4.23 | HF | 4.42 | HF | 4.33 | HF |
regarding student progress in sixth place at 4.32. Building partnerships with other schools or organizations ranked seventh at 4.29, followed by advocating for the welfare and needs of students in community settings in eighth place at
4.28. Incorporating community resources into classroom learning ranked ninth at 4.27, while organizing or participating in outreach and extension projects ranked last at 4.24.
By respondent group, school heads rated this area highest at 4.71, Highly Fulfilled, followed by non-teaching personnel at 4.42 and teachers at 4.23, both also Highly Fulfilled; supervisors rated it lowest, at 3.97, within the Fulfilled range.
These high fulfillment ratings reflect active involvement with parents, local stakeholders, and community initiatives, suggesting that such collaboration strengthens school-community connections and improves support for students.
This finding is supported by Epstein et al. (2024), who found that structured frameworks integrating school-based community programs with proactive parent-teacher collaboration play a critical role in reinforcing educators' professional purpose and sustaining their careers. Their study shows that when school staff actively partner with external stakeholders to develop outreach initiatives, the resulting social support
network strengthens not only students' experience but also institutional motivation and overall teacher fulfillment.
| Criteria | Supervisors | School Heads | Teachers | Non-Teaching Personnels | Composite | Rank | |||||
| WM | VI | WM | VI | WM | VI | WM | VI | WM | VI | ||
| 1.Instructional Delivery and Classroom Management | 4.01 | F | 4.65 | HF | 4.24 | HF | 4.34 | HF | 4.31 | HF | 5 |
| 2.Learner Engagement and Achievement | 4.05 | F | 4.59 | HF | 4.29 | HF | 4.43 | HF | 4.34 | HF | 3 |
| 3.Assessmentand Feedback Practices | 4.04 | F | 4.68 | HF | 4.29 | HF | 4.44 | HF | 4.36 | HF | 2 |
| 4.Professional Growth and Accountability | 4.09 | F | 4.71 | HF | 4.33 | HF | 4.49 | HF | 4.40 | HF | 1 |
| 5.Communityand Stakeholder Involvement | 3.97 | F | 4.71 | HF | 4.23 | HF | 4.42 | HF | 4.33 | HF | 4 |
| Grand Mean | 4.03 | F | 4.67 | HF | 4.28 | HF | 4.42 | HF | 4.35 | HF |
Table 33 consolidates the five dimensions of teachers' fulfillment, which together produced a grand mean of 4.35, Highly Fulfilled. Professional growth and accountability ranked first at 4.40, followed by assessment and feedback practices in second place at 4.36. Learner engagement and achievement ranked third at 4.34, ahead of community and stakeholder involvement in fourth place at 4.33, while instructional delivery and classroom management ranked last at 4.31.
By respondent group, school heads rated overall teacher fulfillment highest, with a grand mean of 4.67, Highly
Fulfilled, followed by non-teaching personnel at 4.42 and teachers at 4.28, both also Highly Fulfilled; supervisors rated it lowest, at 4.03, within the Fulfilled range.
The consistently high fulfillment ratings across all five dimensions indicate that teachers are successfully carrying out their professional duties, supporting a positive and effective learning environment. The differences in ratings among respondent groups reflect varied vantage points on teacher performance, underscoring the value of ongoing dialogue and cooperation within the school community.
This finding is consistent with Evans and Hargreaves (2023), whose research shows that sustainable teacher fulfillment depends not only on physical classroom resources but on a broader school ecosystem that emphasizes continuous professional development, constructive formative feedback, and active stakeholder engagement. Their study underscores that when educators receive strong support for their growth and have access to effective administrative tools for monitoring student progress, their sense of institutional purpose and professional self-efficacy improves considerably.
Sub-problem No. 5. Is there a significant relationship among the Digital Aptitudes, Professional Collaboration and Administrative Support, and Teachers’ Fulfillment?
| Areas of Concern | r-value | VI | df | t-value | Critical value | Int. | Decision |
| 1. Digital Literacy | 0.99 | VSC | 18 | 4.24052 | 1.734 | Significant | Reject Ho |
| 2. InstructionalTechnology Integration | 0.99 | VSC | 18 | 4.24153 | 1.734 | Significant | Reject Ho |
| 3. Online Classroom Management | 0.99 | VSC | 18 | 4.24232 | 1.734 | Significant | Reject Ho |
| 4. Content Creation and Curation | 0.99 | VSC | 18 | 4.24219 | 1.734 | Significant | Reject Ho |
| 5. Cybersecurity Awareness | 0.99 | VSC | 18 | 4.24218 | 1.734 | Significant | Reject Ho |
| 6. Digital Communication Skills | 0.99 | VSC | 18 | 4.24245 | 1.734 | Significant | Reject Ho |
| 7. Use of Educational Platforms | 0.99 | VSC | 18 | 4.24241 | 1.734 | Significant | Reject Ho |
| 8. Problem-SolvinginDigital Contexts | 0.99 | VSC | 18 | 4.24245 | 1.734 | Significant | Reject Ho |
| 9. AdaptabilitytoEmerging Technologies | 0.99 | VSC | 18 | 4.24250 | 1.734 | Significant | Reject Ho |
| 10. Digital Ethics and Responsibility | 1.00 | PC | 18 | 4.24257 | 1.734 | Significant | Reject Ho |
| 11. Data Management Preservation | 0.99 | VSC | 18 | 4.24217 | 1.734 | Significant | Reject Ho |
| 12. Data Survival Skills | 1.00 | PC | 18 | 4.24254 | 1.734 | Significant | Reject Ho |
Legend:
| Range | Verbal Interpretation | Symbol |
| 1.0 | Perfect Correlation | PC |
| 0.71 – 0.99 | Very Strong Correlation | VSC |
| 0.51 - 0.70 | Strong Correlation | SC |
| 0.31 – 0.50 | Moderate Correlation | MC |
| 0.11 – 0.30 | Weak Correlation | WC |
| 0.0 – 0.10 | Negligible Correlation | NC |
Table 34 reveals a very strong to perfect positive correlation between teachers' digital aptitudes and their level of fulfillment, with r-values ranging from 0.99 to 1.00 across all twelve indicators. Every computed t-value exceeded the critical value of 1.734 at 18 degrees of freedom: digital
literacy yielded a t-value of 4.24052, instructional technology integration 4.24153, online classroom management 4.24232, content creation and curation 4.24219, cybersecurity awareness 4.24218, digital communication skills 4.24245, use of educational platforms 4.24241, problem-solving in digital contexts 4.24245, adaptability to emerging technologies 4.24250, digital ethics and responsibility 4.24257, data management preservation 4.24217, and digital survival skills 4.24254. Every indicator was therefore interpreted as significant, leading to rejection of the null hypothesis in each case.
These results indicate that greater proficiency in digital aptitudes is strongly associated with higher levels of teacher fulfillment, underscoring the critical role of digital skill in professional effectiveness and satisfaction.
This finding is supported by Guillén-Gámez et al. (2024), who found that advanced digital competence extends well beyond basic operational skill to become a key driver of educators' self-efficacy and pedagogical confidence. Their study shows that mastery of digital platforms, online classroom
management, and data systems meaningfully reduces work-related stress and enhances professional empowerment.
| Indicators | r-value | VI | df | t-value | Critical value | Int. | Decision |
| 1. Shared Vision and Goal Alignment | 0.99 | VSC | 18 | 4.24250 | 1.734 | Significant | Reject Ho |
| 2. Collaborative Planning and Teamwork | 0.99 | VSC | 18 | 4.24244 | 1.734 | Significant | Reject Ho |
| 3. Instructional Leadership and Supervisory Support | 0.99 | VSC | 18 | 4.24233 | 1.734 | Significant | Reject Ho |
| 4. Communicationand Decision-Making Support | 0.99 | VSC | 18 | 4.24232 | 1.734 | Significant | Reject Ho |
| 5. Recognition, Motivation, and Well-Being Support | 0.99 | VSC | 18 | 4.24234 | 1.734 | Significant | Reject Ho |
Table 35 shows a very strong positive correlation between each professional collaboration and administrative support indicator and teachers' fulfillment, with r-values of 0.99 across all five measures. The corresponding t-values — 4.24250 for shared vision and goal alignment, 4.24244 for collaborative planning and teamwork, 4.24233 for instructional leadership and supervisory support, 4.24232 for communication and decision-making support, and 4.24234 for recognition, motivation, and well-being support — all exceeded the critical value of 1.734 at 18 degrees of freedom, confirming significance across the board.
Because every correlation proved significant, the null
hypothesis was rejected in each case, indicating that stronger professional collaboration and administrative support are significantly associated with higher levels of teacher fulfillment.
This finding is supported by Aas and Brandmo (2023), whose research on school organizational climate found that supportive administrative practices and cooperative staff structures are direct predictors of teacher retention and satisfaction. Their study shows that when school management deliberately fosters shared vision, instructional leadership support, and transparent communication, it creates a workplace climate that meaningfully strengthens teachers' sense of professional fulfillment and occupational efficacy.
Sub-problem No. 6. What are the challenges encountered by the respondents relative to Digital Aptitudes, Professional Collaboration, and Administrative Support?
34.1. Digital Aptitudes
-
Table 36 sets out the challenges respondents encountered relative to digital aptitudes as Encountered overall, earning a composite weighted mean of 3.95. One indicator
| Indicators | Supervisors | School Heads | Teachers | Non-Teaching Personnels | Composite | Rank | |||||
| WM | VI | WM | VI | WM | VI | WM | VI | WM | VI | ||
| 1. Limited access to reliable internet connectivity for teaching and administrative tasks. | 4.25 | HE | 4.33 | HE | 3.98 | E | 4.27 | HE | 4.21 | HE | 1 |
| 2. Lack of sufficient digital devices (computers, tablets, or smartphones) for teachers and students. | 4.00 | E | 4.20 | HE | 3.74 | E | 4.05 | E | 4.00 | E | 2 |
| 3.Insufficienttrainingor orientation on emerging digital tools and platforms. | 4.00 | E | 4.20 | HE | 3.68 | E | 4.02 | E | 3.98 | E | 3 |
| 4.Difficultyinintegrating technologyeffectivelyinto lesson plans. | 4.00 | E | 4.20 | HE | 3.56 | E | 3.85 | E | 3.90 | E | 6.33 |
| 5. Low digital literacy among teachers, students, or non-teaching personnel. | 4.00 | E | 4.13 | E | 3.54 | E | 3.88 | E | 3.89 | E | 9 |
| 6. Challenges in managing online classroom activities and student participation. | 3.88 | E | 4.27 | HE | 3.59 | E | 3.93 | E | 3.92 | E | 5 |
| 7.Limited technical support or IT assistance in school settings. | 3.88 | E | 4.20 | HE | 3.62 | E | 4.05 | E | 3.94 | E | 4 |
| 8. Cybersecuritythreats, including phishing, malware, or data breaches. | 3.88 | E | 4.27 | HE | 3.57 | E | 3.88 | E | 3.90 | E | 6.33 |
| 9. Inadequate digital resources or educational software for teaching. | 3.88 | E | 4.20 | HE | 3.60 | E | 3.93 | E | 3.90 | E | 6.33 |
| 10. Difficulty adapting to new technologies or updates in digital platforms. | 3.88 | E | 4.07 | E | 3.54 | E | 3.88 | E | 3.84 | E | 10 |
| Overall Weighted Mean | 3.97 | E | 4.21 | HE | 3.64 | E | 3.97 | E | 3.95 | E | |
| Legend: | Range | Scale | Verbal Interpretation | Symbol | |||||||
| 5 | 4.20-5.00 | Highly Encountered | HE | ||||||||
| 4 | 3.40-4.19 | Encountered | E | ||||||||
| 3 | 2.60-3.39 | Moderately Encountered | ME | ||||||||
| 2 | 1.80-2.59 | Least Encountered | LE | ||||||||
| 1 | 1.00-1.79 | Not Encountered | NE |
was rated Highly Encountered: limited access to reliable internet connectivity for teaching and administrative
tasks, which ranked first at 4.21. The remaining nine indicators were rated Encountered. Lack of sufficient digital devices, such as computers, tablets, or smartphones, for teachers and students ranked second at 4.00, followed by insufficient training or orientation on emerging digital tools and platforms in third place at 3.98. Limited technical support or IT assistance in school settings ranked fourth at 3.94, ahead of challenges in managing online classroom activities and student participation in fifth place at 3.92. Difficulty integrating technology effectively into lesson plans, cybersecurity threats such as phishing, malware, or data breaches, and inadequate digital resources or educational software for teaching tied for sixth through eighth place, each at 3.90. Low digital literacy among teachers, students, or non-teaching personnel ranked ninth at 3.89, while difficulty adapting to new technologies or platform updates ranked last at 3.84.
-
By respondent group, school heads rated these challenges as Highly Encountered, at 4.21; supervisors and non-teaching
personnel both rated them Encountered, at 3.97 each; and teachers likewise rated them Encountered, at 3.64.
-
This indicates that challenges related to digital aptitudes are generally encountered across the Division, with limited access to reliable internet connectivity standing out as the most highly encountered concern. The fact that school heads rated these challenges as highly encountered while other groups rated them merely encountered suggests that digital barriers, while widely experienced, may be felt differently depending on one's role — a pattern with implications for how technology gets implemented in teaching and administrative work.
-
This finding is corroborated by the World Bank Group (2025), which found that despite strong national directives pushing digital transformation, structural deficiencies at the macro level continue to hamper local implementation. Their analysis shows that outdated policy frameworks and uneven geographic distribution of fiber-optic infrastructure limit classroom-level connectivity, creating a bottleneck in which educators possess the willingness to
use digital technology but remain constrained by systemic hardware and internet limitations.
-
Professional Collaboration and Administrative Support
| Indicators | Supervisors | School Heads | Teachers | Non-Teaching Personnels | Composite | Rank | |||||
| WM | VI | WM | VI | WM | VI | WM | VI | WM | VI | ||
| 1. Lack of clear communication channels between supervisors, school heads, and teachers. | 4.00 | E | 4.07 | E | 3.22 | ME | 3.59 | E | 3.72 | E | 8 |
| 2. Insufficient support or guidance from school administrators on instructional or digital matters. | 4.00 | E | 4.07 | E | 3.21 | ME | 3.66 | E | 3.74 | E | 4.25 |
| 3. Limitedopportunitiesfor collaborativeplanningor teamwork among staff. | 3.88 | E | 4.20 | HE | 3.27 | ME | 3.76 | E | 3.78 | E | 2 |
| 4. Conflicts or misalignment in shared vision and school goals. | 3.88 | E | 4.13 | E | 3.19 | ME | 3.63 | E | 3.71 | E | 9 |
| 5. Low recognition or motivation for teacherachievementsand contributions. | 3.88 | E | 4.00 | E | 3.18 | ME | 3.61 | E | 3.67 | E | 10 |
| 6. Delays or inefficiencies in decision-making processes at the school or district level. | 3.88 | E | 4.13 | E | 3.24 | ME | 3.71 | E | 3.74 | E | 4.25 |
| 7. Inadequateresourcesto implementcollaborative programs or initiatives. | 4.00 | E | 4.13 | E | 3.25 | ME | 3.76 | E | 3.79 | E | 1 |
| 8. Challengesinproviding professionaldevelopment opportunities consistently. | 3.88 | E | 4.07 | E | 3.24 | ME | 3.76 | E | 3.74 | E | 4.25 |
| 9. Resistance to change or innovation among staff members. | 4.00 | E | 4.13 | E | 3.20 | ME | 3.63 | E | 3.74 | E | 4.25 |
| 10.Difficultybalancing administrative duties with teaching responsibilities. | 3.88 | E | 4.07 | E | 3.30 | ME | 3.73 | E | 3.75 | E | 3 |
| Overall Weighted Mean | 3.93 | E | 4.10 | E | 3.23 | ME | 3.68 | E | 3.74 | E |
Table 37 sets out the challenges respondents encountered relative to professional collaboration and administrative support, as encountered overall, earning a composite weighted mean of 3.74. All ten indicators fell in the Encountered range. Inadequate resources to implement collaborative programs or initiatives ranked first at 3.79, followed by limited opportunities for collaborative planning or teamwork among staff in second place at 3.78. Difficulty balancing administrative duties with teaching responsibilities ranked third at 3.75, ahead of insufficient support or guidance from school administrators on instructional or digital matters, delays or inefficiencies in decision-making at the school or district level, challenges in providing professional development opportunities consistently, and resistance to change or innovation among staff members, which tied for fourth through seventh place, each at 3.74. Lack of clear communication channels between supervisors, school heads, and teachers ranked eighth at 3.72, followed by conflicts or misalignment in shared vision and school goals in ninth place at 3.71, while low recognition or motivation for teacher
achievements and contributions ranked last at 3.67.
By respondent group, school heads rated these challenges as Encountered, at 4.10, followed by supervisors at 3.93 and non-teaching personnel at 3.68, also Encountered; teachers rated them lowest, at 3.23, within the Moderately Encountered range.
The variation in how these challenges are experienced across groups suggests that professional collaboration and administrative support issues affect stakeholders unevenly, which could in turn affect the overall effectiveness of teamwork and leadership within schools. Addressing these divergent perceptions matters for fostering a more cohesive and supportive school environment.
This finding is supported by Nguyen and Ng (2024), who examined organizational stress and resource constraints within public school systems. Their research concludes that when institutional funding or resource allocation fails to keep pace with collaborative mandates, teachers face a genuine time-and-resource deficit; forcing educators to juggle mounting administrative obligations alongside their core instructional
duties creates a structural bottleneck that limits genuine opportunities for collective teamwork and planning.
Sub-problem No. 7. Based on the findings, what capacity development plan may be proposed?
Drawing on the findings from public elementary schools in the Division of Pasig City, the proposed capacity development plan for Academic Year 2027–2028 centers on three priority areas: strengthening digital skills, enhancing collaboration and administrative support, and sustaining teacher fulfillment. Although respondents already report generally high levels across these areas, the plan is designed to provide targeted training, stronger technology resources, and regular teamwork activities to build further on this foundation. Planned activities include digital skills workshops, improved internet access, scheduled collaborative planning sessions, and programs that support teachers' professional growth and well-being. Teachers, school leaders, supervisors, and IT staff are expected to work together throughout the year, with funding drawn from government allocations and partner organizations. Progress will be tracked through measurable
gains in digital proficiency, teamwork, teacher satisfaction, and student learning outcomes, allowing the Division to monitor implementation and address emerging challenges as they arise. This strategic direction is supported by Harris and Jones (2024), who found that isolated professional development sessions rarely produce lasting institutional change. Their research shows that the most effective school intervention modelsexplicitlycombinetechnologyupskillingwith structured collaborative frameworks and well-being programs, translating systemic data into everyday school-wide practice. By deliberately linking funding, IT support, and stakeholder feedback to student learning outcomes, the proposed capacity development plan reflects these same principles of sustainable institutional development — aiming to preserve the Division's alreadyhighfulfillmentscoreswhileaddressingthe
infrastructure gaps identified in this study.
Sub-problem No. 8. How suitable, acceptable, and feasible is the proposed intervention plan?
| Indicators | Supervisors | School Heads | Teachers | Non-Teaching Personnels | Composite | Rank | |||||
| WM | VI | WM | VI | WM | VI | WM | VI | WM | VI | ||
| 1. Addresses gaps in teachers’ digital aptitudes (e.g., literacy, cybersecurity,instructional technology integration). | 4.50 | HS | 4.50 | HS | 4.35 | HS | 4.50 | HS | 4.46 | HS | 1 |
| 2. Enhancesprofessional collaboration and administrative support in schools. | 4.29 | HS | 4.64 | HS | 4.30 | HS | 4.50 | HS | 4.43 | HS | 2 |
| 3. Improves teachers’ fulfillment in instructional delivery, learner engagement,assessment practices, and community involvement. | 4.07 | S | 4.57 | HS | 4.31 | HS | 4.13 | S | 4.27 | HS | 5 |
| 4. Aligns with DepEd standards, curriculum requirements, and school improvement priorities. | 4.29 | HS | 4.57 | HS | 4.28 | HS | 4.25 | HS | 4.35 | HS | 3.5 |
| 5. Promotes sustainable capacity- building practices for long-term educational outcomes. | 4.21 | HS | 4.57 | HS | 4.38 | HS | 4.25 | HS | 4.35 | HS | 3.5 |
| Overall Weighted Mean | 4.27 | HS | 4.57 | HS | 4.32 | HS | 4.33 | HS | 4.37 | HS | |
| Legend: | Range | Scale | Verbal Interpretation | Symbol | |||||||
| 5 | 4.20-5.00 | Highly Suitable | HS | ||||||||
| 4 | 3.40-4.19 | Suitable | S | ||||||||
| 3 | 2.60-3.39 | Moderately Suitable | MS | ||||||||
| 2 | 1.80-2.59 | Least Suitable | LS | ||||||||
| 1 | 1.00-1.79 | Not Suitable | NS |
composite weighted mean of 4.37. All five indicators fell in the Highly Suitable range. Addressing gaps in teachers' digital aptitudes — such as literacy, cybersecurity, and instructional technology integration — ranked first at 4.46, followed by enhancing professional collaboration and administrative support in schools in second place at 4.43. Aligning with DepEd standards, curriculum requirements, and
school improvement priorities and promoting sustainable capacity-building practices for long-term educational outcomes tied for third and fourth place, each at 4.35, while improving teachers' fulfillment in instructional delivery, learner engagement, assessment practices, and community involvement ranked last at 4.27.
By respondent group, school heads rated the plan's suitability highest, at 4.57, Highly Suitable, followed by non-teaching personnel at 4.33, teachers at 4.32, and supervisors at 4.27, all likewise Highly Suitable.
This high level of suitability suggests that the plan is well aligned with stakeholder needs and education standards, supporting its potential for successful implementation and positive impact on school performance.
This validation is echoed by Mendoza (2024), whose action-research study on regional basic education mandates found that school-level interventions engineered to map directly onto state-mandated standards, such as the Philippine Professional Standards for Teachers, tend to achieve a strong degree of institutional suitability and stakeholder acceptance.
| Indicators | Supervisors | School Heads | Teachers | Non-Teaching Personnels | Composite | Rank | |||||
| WM | VI | WM | VI | WM | VI | WM | VI | WM | VI | ||
| 1. Recognized by supervisors, school heads, teachers, and non-teaching personnel as beneficial and practical. | 4.30 | HA | 4.57 | HA | 4.38 | HA | 4.36 | HA | 4.40 | HA | 2.33 |
| 2. Encourages active participation and engagement of teachers in capacity-building activities. | 4.30 | HA | 4.57 | HA | 4.25 | HA | 4.36 | HA | 4.37 | HA | 5 |
| 3. Supports the values, culture, and context of the Division of Pasig City public elementary schools. | 4.24 | HA | 4.64 | HA | 4.38 | HA | 4.43 | HA | 4.42 | HA | 1 |
| 4. Endorsed by school leadership and aligns with teachers’ professional development needs. | 4.28 | HA | 4.64 | HA | 4.38 | HA | 4.29 | HA | 4.40 | HA | 2.33 |
| 5. Offers flexible and adaptable strategies acceptable to diverse school personnel. | 4.28 | HA | 4.50 | HA | 4.38 | HA | 4.43 | HA | 4.40 | HA | 2.33 |
| Overall Weighted Mean | 4.28 | HA | 4.58 | HA | 4.35 | HA | 4.37 | HA | 4.40 | HA |
Legend:
| Range | Scale | Verbal Interpretation | Symbol |
| 5 | 4.20-5.00 | Highly Acceptable | HA |
| 4 | 3.40-4.19 | Acceptable | A |
| 3 | 2.60-3.39 | Moderately Acceptable | MA |
| 2 | 1.80-2.59 | Least Acceptable | LA |
| 1 | 1.00-1.79 | Not Acceptable | NA |
Table 39 rates the acceptability of the proposed capacity development plan as Highly Acceptable overall, earning a composite weighted mean of 4.40. All five indicators fell in the Highly Acceptable range. Supporting the values, culture, and context of public elementary schools in the Division of Pasig City ranked first at 4.42, followed by being recognized by supervisors, school heads, teachers, and non-teaching personnel as beneficial and practical; being endorsed by school
leadership and aligned with teachers' professional development needs; and offering flexible, adaptable strategies acceptable to diverse school personnel, which tied for second through fourth place, each at 4.40. Encouraging active participation and engagement of teachers in capacity-building activities ranked last at 4.37.
By respondent group, school heads rated the plan's acceptability highest, at 4.58, Highly Acceptable, followed by non-teaching personnel at 4.37, teachers at 4.35, and supervisors at 4.28, all likewise Highly Acceptable.
This indicates broad agreement that the plan supports the values, culture, and context of Pasig City's public elementary schools and is recognized as beneficial and practical across all four respondent groups. The plan is also seen as endorsed by school leadership, aligned with teachers' professional development needs, and flexible enough to suit diverse staff
-
signaling strong readiness for implementation.
This consensus is supported by Bautista and Castro (2023), whose research on school improvement plans in the Philippines found that acceptability depends heavily on contextualization
-
specifically, how well strategic activities align with the localized values and institutional culture of the school division. Their study shows that action plans incorporating flexible, adaptable strategies that address teachers' professional development needs while honoring local context are more likely to secure genuine buy-in from supervisors, school heads, and teachers alike.
| Indicators | Supervisors | School Heads | Teachers | Non-Teaching Personnels | Composite | Rank | |||||
| WM | VI | WM | VI | WM | VI | WM | VI | WM | VI | ||
| 1. Can be executed within available school resources, facilities, and technology. | 4.24 | HF | 4.50 | HF | 4.38 | HF | 4.14 | F | 4.32 | HF | 4 |
| 2. Requires manageable budget and time allocations for implementation. | 4.26 | HF | 4.57 | HF | 4.38 | HF | 4.36 | HF | 4.39 | HF | 3 |
| 3. Supported by qualified facilitators, mentors, and administrative staff. | 4.30 | HF | 4.57 | HF | 4.38 | HF | 4.43 | HF | 4.42 | HF | 1.5 |
| 4. Integrates effectively into the school calendar without disruptinginstructional activities. | 4.28 | HF | 4.50 | HF | 4.13 | F | 4.29 | HF | 4.30 | HF | 5 |
| 5. Includes monitoring and evaluation mechanisms to ensure successful execution and outcomes. | 4.28 | HF | 4.57 | HF | 4.38 | HF | 4.43 | HF | 4.42 | HF | 1.5 |
| Overall Weighted Mean | 4.27 | HF | 4.54 | HF | 4.33 | HF | 4.33 | HF | 4.37 | HF | |
| Legend: | Range | Scale | Verbal Interpretation | Symbol | |||||||
| 5 | 4.20-5.00 | Highly Feasible | HF | ||||||||
| 4 | 3.40-4.19 | Feasible | F | ||||||||
| 3 | 2.60-3.39 | Moderately Feasible | MF | ||||||||
| 2 | 1.80-2.59 | Least Feasible | LF | ||||||||
| 1 | 1.00-1.79 | Not Feasible | NF |
Table 40 rates the feasibility of the proposed capacity
development plan as Highly Feasible overall, earning a composite weighted mean of 4.37. All five indicators fell in the Highly Feasible range. Being supported by qualified facilitators, mentors, and administrative staff and including monitoring and evaluation mechanisms to ensure successful execution tied for first place, each at 4.42, followed by requiring manageable budget and time allocations for implementation in third place at 4.39. The ability to be executed within available school resources, facilities, and technology ranked fourth at 4.32, while integrating effectively into the school calendar without disrupting instructional activities ranked last at 4.30.
By respondent group, school heads rated the plan's feasibility highest, at 4.54, Highly Feasible, followed by teachers and non-teaching personnel, tied at 4.33, and supervisors at 4.27, all likewise Highly Feasible.
This indicates strong confidence in the plan's successful implementation. It is seen as supported by qualified facilitators, equipped with effective monitoring and evaluation mechanisms, achievable within a manageable budget
and timeframe, executable using available school resources and technology, and compatible with the existing school calendar
-
all factors that point to the plan's practicality and readiness for execution across every respondent group.
This finding is supported by Santos and Villanueva (2024), whose research on the practical execution of school-based action plans found that operational feasibility depends heavily on human capital readiness — specifically the presence of trained mentors and supportive administrative personnel — together with structured tracking frameworks. Their study emphasizes that transparent monitoring mechanisms paired with realistic fiscal and time planning help prevent administrative overload and support long-term program sustainability.
Summary, Conclusions, and Recommendations
Summary
Based on the analysis and interpretation of the gathered data, the study yielded the following findings:
-
On the assessment of supervisors, school heads, teachers, and non-teaching personnel as to the digital aptitudes of public elementary schools in the Division of Pasig City, the overall rating was Highly Evident, with a grand mean of 4.36.
-
On the assessment of the same four respondent groups as to professional collaboration and administrative support in public elementary schools in the Division of Pasig City, the overall rating was likewise Highly Evident, with a grand mean of 4.42.
-
On the significant difference among the assessments of supervisors, school heads, teachers, and non-teaching personnel as to digital aptitudes and professional collaboration and administrative support, the comparative analysis of digital aptitudes across the four groups and
twelve areas yielded F-values consistently well below the critical value of 2.87, indicating no statistically significant differences among the groups; the null hypothesis was therefore not rejected. Likewise, the comparative analysis of professional collaboration and administrative support across the four groups and five areas produced F-values well below the same critical value of 2.87, again indicating no statistically significant differences among the groups and leading to the same decision not to reject the null hypothesis.
-
On the level of teachers' fulfillment in public elementary schools in the Division of Pasig City, as assessed by supervisors, school heads, teachers, and non-teaching personnel, the overall rating was Highly Fulfilled, with a grand mean of 4.35.
-
On the significant relationship among digital aptitudes, professional collaboration and administrative support, and teachers' fulfillment, a very strong to perfect positive correlation, with r-values ranging from 0.99 to 1.00, was found between teachers' digital aptitudes and their level
of fulfillment across all twelve indicators, with every computed t-value exceeding the critical value of 1.734 — a result that proved significant and led to rejection of the null hypothesis. Similarly, a very strong positive correlation of 0.99 was found between professional collaboration and administrative support and teachers' fulfillment across all five indicators, with every t-value again exceeding the critical value of 1.734, confirming a significant relationship in each case.
-
On the challenges encountered by respondents relative to digital aptitudes and professional collaboration and administrative support, challenges tied to digital aptitudes were rated Encountered, with an overall weighted mean of 3.95, while challenges tied to professional collaboration and administrative support were likewise rated Encountered, with an overall weighted mean of 3.74.
-
On the proposed capacity development plan, the plan drafted for Academic Year 2027–2028 in Pasig City's public elementary schools is built around strengthening digital skills, collaboration, administrative support, and teacher
fulfillment. It is organized into key result areas, each specifying objectives, strategies, activities, the department responsible, a timeframe, a budget with funding sources, and performance indicators.
-
On the suitability, acceptability, and feasibility of the proposed capacity development plan, the plan was rated Highly Suitable, with an overall weighted mean of 4.37; Highly Acceptable, with an overall weighted mean of 4.40; and Highly Feasible, with an overall weighted mean of 4.37.
Conclusions
Based on the findings, the following conclusions were drawn:
-
Digital aptitudes among supervisors, school heads, teachers, and non-teaching personnel in public elementary schools in Pasig City are clearly and consistently evident.
-
Professional collaboration and administrative support within these schools are well established.
-
No statistically significant differences exist in digital aptitudes or in professional collaboration and administrative support among supervisors, school heads,
teachers, and non-teaching personnel in public elementary schools in Pasig City.
-
Teachers experience a high level of fulfillment, consistent with the generally favorable assessments of digital aptitudes and collaborative efforts across the Division.
-
A very strong and statistically significant positive relationship exists both between teachers' digital aptitudes and their fulfillment, and between professional collaboration and administrative support and their fulfillment — underscoring how central these two factors are to teacher contentment.
-
Challenges related to digital aptitudes and to professional collaboration and administrative support are moderately experienced across the Division.
-
The proposed capacity development plan for Academic Year 2027–2028 deliberately targets the improvement of digital skills, collaboration, administrative support, and teacher fulfillment through detailed, well-organized initiatives.
-
Stakeholders regard the intervention plan as highly suitable, acceptable, and feasible for implementation.
Recommendations
Based on the findings and conclusions, the following are recommended:
-
To build further on the already strong digital aptitudes evident among all personnel, the Pasig City Schools Division Office (PSDO) may implement quarterly digital skills training workshops beginning in the first quarter of Academic Year 2027–2028, targeting a fifteen percent improvement in digital proficiency scores by year-end.
-
To strengthen the already well-established professional collaboration and administrative support, school heads and administrative staff may organize monthly collaboration and team-building activities, targeting a ten percent increase in teamwork effectiveness within six months.
-
Given the consistency in digital aptitudes and collaboration across respondent groups, the PSDO may conduct annual assessments to monitor staff capabilities and perceptions, ensuring that this consistency is maintained, with reports submitted at the end of each academic year.
-
To sustain the high level of teacher fulfillment, school leaders and supervisors may develop and implement recognition programs that formally acknowledge exemplary performance, scheduling at least one recognition event each semester.
-
To build on the strong positive associations among digital aptitudes, collaboration, and teacher fulfillment, the PSDO, in coordination with its IT department, may integrate digital skills development with professional collaboration and well-being initiatives, aiming to launch at least three such integrated programs by mid-2028.
-
To address the moderate challenges reported in digital aptitudes and professional collaboration, school administrators may conduct biannual surveys to identify specific concerns and provide targeted support, aiming to reduce reported challenges by twenty percent within one year.
-
To ensure the effective enhancement of skills, collaboration, support, and fulfillment, the Planning and Development Unit of the PSDO, together with other
stakeholders, may fully implement the capacity development plan with clear timelines, responsibilities, and budget allocations, beginning in Academic Year 2027–2028 and providing quarterly progress updates.
-
To maintain the plan's high suitability, acceptability, and feasibility, all stakeholders — including teachers, supervisors, school heads, and IT personnel — may take part in regular feedback sessions to evaluate and refine the plan throughout its implementation.
-
Future researchers may explore the long-term impact of capacity development initiatives on student learning outcomes to measure their sustained effectiveness across multiple academic years.
Appendix
A. Research Output
RATIONALE
The Department of Education continuously promotes quality, inclusive, and technology-driven education through the MATATAG Agenda, the Digital Education Framework, and the Philippine Professional Standards for Teachers (PPST). As educational institutions adapt to the demands of the digital age, it becomes essential for school personnel to continuously strengthen their digital competencies, collaborative practices, and professional well-being to effectively deliver learner-centered and future-ready education.
This Proposed Capacity Development Plan is designed to sustain and further enhance the digital competencies, collaborative culture, administrative support mechanisms, and professional fulfillment of supervisors, school heads, teachers, and non-teaching personnel in public elementary schools. Through targeted training programs, collaborative learning opportunities, leadership development initiatives, technology enhancement activities, and employee well-being interventions, the plan seeks to address identified challenges while reinforcing existing strengths. Ultimately, the program aims to support the realization of the Department of Education's vision of producing competent, innovative, resilient, and highly motivated educational professionals capable of delivering quality education and improving learner outcomes in the Schools Division Office of Pasig City for Academic Year 2027–2028.
General Objective
To strengthen the digital aptitudes, professional collaboration and administrative support, and teachers’ fulfillment among public elementary school personnel in the Schools Division Office of Pasig City through sustainable capacity-building initiatives aligned with the Department of Education MATATAG Agenda, Digital Education Framework, and PPST for Academic Year 2027–2028.
Specific Objectives
-
Digital Aptitudes
-
Enhance competencies in instructional technology integration, online classroom management, content creation and curation, use of educational platforms, and problem-solving in digital contexts, which emerged as the relatively lower-ranked indicators of digital aptitudes.
-
Strengthen the capability of school personnel in adapting emerging technologies, cybersecurity awareness, digital ethics and responsibility, and data management practices to support effective teaching and administrative functions.
-
Improve access to digital resources, internet connectivity, technical assistance, and digital learning tools to address the identified challenges encountered by school personnel.
-
Promote continuous professional learning and technology-enhanced instructional practices that support the effective implementation of the MATATAG Curriculum.
-
Professional Collaboration and Administrative Support
-
Strengthen instructional leadership, supervisory support, collaborative planning, and teamwork to enhance professional collaboration among school personnel.
-
Improve communication systems and shared decision-making processes to foster a culture of transparency, participation, and accountability within schools.
-
Expand opportunities for professional development, mentoring, coaching, and collaborative learning activities to support continuous improvement and innovation.
-
Increase the availability of resources and support mechanisms needed for the effective implementation of collaborative programs and school improvement initiatives.
-
Teachers’ Fulfillment
-
Enhance instructional delivery and classroom management practices through relevant professional development and coaching programs.
-
Strengthen learner engagement, achievement, assessment, and feedback practices to support effective teaching and learning outcomes.
-
Promote professional growth, accountability, recognition, and career development opportunities that contribute to higher levels of teacher motivation and satisfaction.
-
Foster stronger community and stakeholder involvement to create a supportive educational environment that enhances teachers’ sense of fulfillment and commitment.
Organizational Sustainability
-
Sustain the existing high levels of digital aptitude, professional collaboration, administrative support, and teacher fulfillment through institutionalized capacity development programs.
-
Strengthen the alignment of school programs, policies, and practices with the Department of Education's MATATAG Agenda and digital transformation initiatives.
-
Cultivate a future-ready, collaborative, digitally competent, and highly motivated educational workforce capable of delivering quality, inclusive, and learner-centered education.
These objectives are directly aligned with the findings by focusing on the lowest-ranked indicators and most encountered challenges while sustaining the strengths identified in Digital Aptitudes, Professional Collaboration and Administrative Support, and Teachers’ Fulfillment.
Department of Education
PROPOSED CAPACITY DEVELOPMENT PLAN (CDP)
Academic Year 2027–2028
Region: NATIONAL CAPITAL REGION
Division: Pasig City
School:
-
PROGRAM PROFILE
| Title of Program | STRENGTHENING KEY AREAS: DIGITAL APTITUDES, PROFESSIONAL COLLABORATION, AND TEACHERS’ FULFILLMENT |
| Program Description | A series of capacity-building initiatives designed to empower educators through digital innovations, collaborative leadership, and professional fulfillment aligned with the DepEd MATATAG agenda, Digital Education Framework, and PPST standards. |
| Purpose | To develop competencies in digital skills, professional collaboration, instructional delivery, and teacher fulfillment for effective education service delivery. |
| Target Participants | All teaching and non-teaching personnel |
| Program Duration | January 2027 to December 2028 |
| Prepared By | Nestor A. Madi Jr. |
-
CAPACITY DEVELOPMENT PLAN
| Key Result Areas | Objective | Strategy | Activities | Person Involved | Time Frame | Budget | Performanc e Indicators |
| A. DIGITAL APTITUDE | |||||||
| 1. Instructional Technology Integration | Increase teacher competence in using interactive digital tools to booststudent engagement | Provide hands-on exposure and practice using popular interactive tools | Workshop on Kahoot!, Quizizz Peer mentoring Implementation monitoring & feedback | Teachers, School Heads, Supervisors | July–August 2027 | Facilitator fees: 12,000 Training materials & printouts: 5,000 Venue/Facility use: 3,000 | 85% teachers able to design & implement quizzes |
| Refreshments: 5,000 | |||||||
| Build teachers’ | Facilitate | Monthly hands- | Teachers, | Sept 2027– | Platform | 75%report | |
| confidenceto adoptnew | ongoing “TechTry- | on sessions | Supervisors, IT Support | Mar 2028 | subscriptions: 8,000 | increased confidence |
| educational | outs” | Sharingbest | |||||
| technologies | sessions | practices | Mini-grants for | ||||
| forums | experimentatio n: 6,000 | ||||||
| Support group formation | Meeting logistics: | ||||||
| 3,000 | |||||||
| Refreshments: | |||||||
| 3,000 | |||||||
| Develop skills in using collaborative platformsfor online learning | Deliver training and guided project imp | Google Classroom/MS Teams training Collaborative lessonplan development Project implementation | Teachers, School Heads | Oct–Nov 2027 | Trainer fees: 8,000 Internet/data support: 4,000 Materials & handouts: 3,000 | 80% implement one collaborative project | |
| Improve monitoring and evaluationon tech usage | Capacity building on evaluation, metrics, feedback | Evaluation workshop Checklist development | Supervisors, School Heads, Teachers | Jan 2028 | Facilitator fees: 7,000 Materials & printing: 3,000 | 70%have measurable evaluation data | |
| Data analysis & improvement plan | Venue/refresh ments: 2,000 | ||||||
| Enhance | Train | Evaluation | Teachers, | Feb 2028 | Software | 85%adopt | |
| efficiencyof student | teachers on digital | workshop | School Heads | licensing: 7,000 | onedigital assessment | ||
| assessments via digital | assessment toolsand LMS | Checklist development | Training materials: | tool | |||
| Data analysis & | 5,000 | ||||||
| improvement plan | Refreshments/ logistics: | ||||||
| 3,000 | |||||||
| Ensure tech activities align with curriculum goals | Alignment workshops, review lesson plans | Curriculum-tech alignment workshop Collaborative lesson planning Lessonplan reviewand feedback | Supervisors, School Heads, Curriculum Coordinators | Apr 2028 | Facilitator fees: 7,000 Printing materials: 3,000 Venue & refreshments: 2,000 | 90%lesson plans aligned with curriculum | |
| Equip teachers for differentiated instruction w/ tech | Training on adaptive learning platforms | Adaptive learningapp training | Supervisors, Teachers | May 2028 | Training facilitator fees: 8,000 | 75% incorporate differentiation | |
| Develop differentiated activities | App subscriptions/t raining aids: |
| Peer coaching | 4,000 Logistics & refreshments: 3,000 | ||||||
| Improve skills in choosing digital toolsper objective | Training & consultations ontool selection | Training workshop on selection criteria Individual lessonplan consultations Practice sessions with digital tools | School Heads, Supervisors, Teachers | June 2028 | Consultant fees: 10,000 Training materials: 4,000 Logistics & refreshments: 4,000 | 85% demonstrate propertool selection | |
| Promote consistent multimedia use toenhance lessons | Organize practice& peer review forums | Multimedia creation workshop Peerreview sessions Observation of multimedia use in teaching | Teachers, Supervisors | June 2028 | Facilitator fees: 5,000 Materials & handouts: 3,000 Refreshments & logistical support: 2,000 | 90% consistently apply multimedia presentations | |
| 3. Online Classroom Management | Improve monitoringof student engagement andtask submissions usingdigital tools | Deliver hands-on training and monitoring support | Training on LMSand tracking tools Implementation of tracking systems Data review and reporting meetings | Teachers, Supervisors, IT Support | June 2028 | Trainer fees: 6,000 Software/licen ses: 3,000 Data meetings: 3,000 | 85% usage of tracking tools |
| Strengthen teacher management of online classroom discipline | Trainon behavior management and intervention strategies | Workshop on managing virtual classroom disruptions Role-playing scenarios and solution modeling Follow-up peer coaching sessions | Teachers, Supervisors | June 2028 | Trainer fees: 5,000 Materials & roleplay: 3,000 Coaching logistics: 2,000 | 75% effectively manage behaviors online | |
| Equip teachers tonurture inclusivity and support in virtual classrooms | Provide training on inclusive online teaching practices | Inclusivity training workshops Develop support | Teachers, Supervisors | June 2028 | Facilitator fees: 6,000 Training materials: 3,000 | 80%report supportive inclusive environments |
| strategies for learners with special needs Reflection and peer support meetings | Support meeting logistics: 3,000 | ||||||
| Develop shared expectations to guide student behavior and learning | Lead workshops for expectation-setting and student orientation planning | Workshop for school heads and teachers ononline expectations Develop online class expectation documents Conduct student orientations on expectations | School Heads, Teachers | Mar 2028 | Workshop facilitation: 8,000 Materials & printing: 4,000 Orientation logistics: 3,000 | 85% compliance with established expectations | |
| Increase use of interactive featuresto booststudent engagement | Offer hands-on workshops and practice on interactive tools | Training on polls, chat, breakout room functions Practice creating interactive activities Share session onbest engagement practices | Teachers, IT Support | Apr 2028 | Trainer fees: 6,000 Support materials: 3,000 Practice session logistics: 3,000 | 80% teachers regularly use interactive features | |
| Improve responsiveness andfeedback turnaround duringonline classes | Empower teachers with digital feedback toolsand follow-up techniques | Workshop on digital feedback tools (comments, annotations, quizzes) Development offeedback schedules Monitoring and reflection sessionson feedback practices | Teachers, Supervisors | May 2028 | Workshop costs: 7,000 Materials & schedules: 4,000 Monitoring: 4,000 | 85% teachers provide timely feedback | |
| Ensure standardized and clear online class routines andrules among teachers | Facilitate development of standard protocols and school-wide disseminatio | Collaborative workshopto develop clear rulesand routines | Supervisors, School Heads, Teachers | Nov 2027– Jan 2028 | Workshop facilitation: 7,000 Printing & dissemination: 4,000 | 80%of classes implement clear routines |
| n | Dissemination of policies and teacher orientation Periodic review and update of rules based on feedback | Review meetings: 4,000 | |||||
| Strengthen communication clarity for better student understanding and compliance | Conduct training on effective online communicati on strategies and tools | Training sessionon creating clear, accessible digital instructions Templates development for communicating objectives and deadlines Feedback and improvement sessionson communication effectiveness | Teachers, Supervisors | Feb 2028 | Facilitator fees: 6,000 Materials/temp lates: 3,000 Feedback session logistics: 3,000 | 85%of students report clarity of instructions | |
| Ensure standardized and clear online class routines andrules among teachers | Facilitate development of standard protocols and school-wide disseminatio n | Collaborative workshopto develop clear rulesand routines Dissemination of policies and teacher orientation Periodic review and update of rules based on feedback | Supervisors, School Heads, Teachers | Nov 2027– Jan 2028 | Workshop facilitation: 7,000 Printing & dissemination: 4,000 Review meetings: 4,000 | 80%of classes implement clear routines | |
| Develop shared expectations to guide student behavior and learning | Lead workshops for expectation-setting and student orientation planning | Workshop for school heads and teachers ononline expectations Develop online class expectation documents Conduct student orientations on expectations | Teachers, Supervisors | May 2028 | Workshop facilitation: 8,000 Materials & printing: 4,000 Orientation logistics: 3,000 | 85% compliance with established expectations |
| 4. Content Creation and Curation | Enhance teachers’ capabilities to integrate gamification in lessons | Conduct training and practice sessions on gamification toolsand techniques | Workshop on gamification tools(e.g., Quizizz, Kahoot!) Design gamified lesson plans Peer review and feedback on gamified lessons | Teachers, Supervisors | June 2028 | Facilitator fees: 5,000 Materials and printouts: 3,000 Refreshments and logistics: 2,000 | 80%of teachers designand implement gamified lessons |
| Support teachers in adapting digital contentto different learner levels | Provide training on differentiated content adaptation | Trainingon content adaptation strategies Develop differentiated teaching materials Sharingand reflecting sessions | Teachers, Supervisors | May 2028 | Training fees: 8,000 Materials printing: 4,000 Logistics and refreshments: 3,000 | 75%of teachers produce adapted content | |
| Equip teachers tocustomize learning materials effectively | Conduct workshops focusing on differentiatio nand personalizati on | Workshop on customization techniques Collaborative content creation sessions Classroom implementation monitoring | Teachers, Supervisors | April 2028 | Facilitator fees: 7,000 Printing and materials: 5,000 Monitoring and feedback: 3,000 | 80%of teachers customize content based onlearners’ needs | |
| Promote organized digital repositories for teaching materials | Train teachers on digital filing and resource management systems | Workshop on digital resource management (Google Drive, OneDrive) Create organized foldersand tagging systems Regular audit and update of repositories | Teachers, Supervisors | March 2028 | Facilitator fees: 6,000 Technical support materials: 3,000<br>• Refreshments: 3,00 | 85% maintain organized digital resources | |
| Encourage development of original, engaging teaching content | Provide hands-on workshops for creating multimedia | Workshop on multimedia authoring tools (Canva, Powtoon) | Teachers, Supervisors | Jan 2028 | Facilitator fees: 7,000 Materials and templates: | 90% of content evaluated and improved |
| teaching aids | Develop original lesson content Peer sharing and improvement sessions | 3,000 Refreshments: 2,000 | |||||
| Improve teachers' skills inassessing digital content | Conduct evaluation training and develop quality checklists | Workshop on content evaluation criteriaand methods Create evaluation rubrics/checklis ts Apply evaluation to existing contentand revise | Teachers, Supervisors | Jan 2028 | Facilitator fees: 7,000 Materials and templates: 3,000 Refreshments: 2,000 | 90% of content evaluated and improved | |
| Encourage periodic content reviewand updates | Establish review protocols and provide training | Trainingon content updating practices Schedule periodic content reviews Share updated materials and best practices | Teachers, Supervisors | Dec 2027 | Trainer fees: 5,000 Materials development: 3,000 Coordination meetings: 2,000 | 85%update content regularly | |
| Foster integrationof multimedia in teaching to increase learner engagement | Provide technical and creative workshops | Hands-on sessionon multimedia creation tools Develop multimedia-enhanced lesson plans Peer evaluation and feedback | Teachers, Supervisors | Nov 2027 | Facilitator fees: 8,000 Software licenses: 4,000 Materials and refreshments: 3,000 | 90% integrate multimedia elementsin lessons | |
| Promote ethical use of digital resources and compliance with copyright | Conduct training on copyright lawsand sourcing of licensed materials | Seminaron copyright principles and legal use of multimedia Share list of copyright- | Teachers, Supervisors | Oct 2027 | Facilitator fees: 6,000 Materials production: 4,000 Distribution | 95% usage compliant with copyright laws |
| free/licensed resources Create resource guidesand checklists for ethical use | and promotion: 2,000 | ||||||
| 5. Problem-Solvingin Digital Contexts | Equip teachers to adapt tech solutions tailoredto school/classroo m contexts | Conduct contextualize d workshops on adapting and modifying digital tools | Workshop on adapting digital toolsfor school-specific needs Groupcase studieson school challenges Documentation ofbest practices and shared solution | Teachers, Supervisors | June 2028 | Facilitator fees: 7,000 Materials and printouts: 4,000 Logistics and refreshments: 4,000 | 85% teachers able to adapt solutions relevantto their contexts |
| Strengthen logical problem-solvingand troubleshooting skills | Provide hands-on logical diagnostics and troubleshooti ng training | Troubleshootin g workshops with practical exercises Develop troubleshooting flowcharts Simulations of digital problem scenarios | Teachers, Supervisors | May 2028 | Trainer fees: 8,000 Materials and guides: 4,000 Refreshments: 3,00 | 85% teachers apply effective troubleshootin g logic | |
| Foster teamworkin solvingtech problems through collaboration | Facilitate collaborative workshops andpeer learning groups | Collaborative problem-solving workshops. Establish onlinepeer support groups Group project onresolving schooltech issues | Teachers, Supervisors, IT Staff | April 2028 | Workshop costs: 6,000 Platform support: 4,000 Meeting logistics: 2,000 | 80% participate activelyin collaborative problem-solving | |
| Improve early detection and rapid response to technical issues | Conduct skill-based workshops andform rapid response teams | Training on common tech issues and fixes Formationof ICTrapid response teams | Teachers, ICT Coordinators , Supervisors | March 2028 | Trainer fees: 7,000 Setup materials: 4,000 Drills and monitoring: 3,000 | 75% decrease inlesson disruptions due to tech issues |
| Regular drills and evaluations | |||||||
| Empower teachers to use digital tools to solve classroom challenges | Train on sourcing and using online tech problem resources | Orientation on digital help resources and tutorials Guided use of troubleshooting online resources Practice applying online resource | Teachers, Supervisors | February 2028 | Trainer fees: 6,000 Materials: 3,000 Logistics and refreshments: 3,000 | 85%use online resources effectively | |
| Build teacher resilience in problem-solving | Facilitate seminars andpeer support for managing tech frustrations | Seminar on resilience and patience Establishment of peer support groups Sharing sessionsfor experiences andcoping strategies | Teachers, Supervisors | January 2028 | Facilitator fees: 6,000 Meeting costs: 3,000 Materials: 3,000 | 80% teachers report improved persistence | |
| Promote effective use of digital resources for addressing challenges | Trainon accessing and leveraging authoritative online resources | Workshop on digital resource navigation. Hands-on application exercises Reflective sharingon resource effectiveness | Teachers, Supervisors | December 2027 | Trainer fees: 6,000 Materials: 3,000 Refreshments: 3,00 | 85% effective use of digital problem-solving resources | |
| Encourage documentation andreflective practice | Establish documentati on systems and reflective practice workshops | Trainingon incident documentation Creationof digital logs or knowledge bases Reflection sessions and preventive strategy development | Teachers, Supervisors | November 2027 | Training materials: 5,000 Setup of logs/software: 3,000 Refreshments: 2,000 | 80% reduction in recurring issues | |
| Inspire creative problem-solving in tech issues | Conduct innovation workshops and | Creativity and innovation skill training | Teachers, Supervisors | October 2027 | Facilitator fees: 6,000 Event costs: | 75%apply innovative solutions |
| challenges | Problem-solving competitions Presentation and scaling of innovative solutions | 4,000 Awards and incentives: 2,000 | |||||
| Build culture of knowledge sharing in digital problem-solving | Organize regular clinics and sharing forums | Monthly problem-solving clinics Peer-led knowledge sharing sessions. Documentation ofbest practices | Teachers, Supervisors | September 2027 | Meeting facilitation: 5,000 Materials: 3,000 Refreshments: 2,000 | 90% participation in knowledge-sharing activities | |
| 6. Useof Educational Platforms | Improve teachers’ ability toutilize platform analyticsfor student monitoring | Conduct targeted training on analytics toolsand data interpretation | Workshop on using analytics features in LMS platforms Hands-on exercises analyzing student data Follow-up coachingon data-driven instruction adjustments | Teachers, Supervisors, ICT Coordinators | June 2028 | Facilitator fees: 6,000 Training materials: 3,000 Refreshments and logistics: 3,00 | 80% teachers effectively use analytics tools |
| Enhance teachers’ troubleshooting skills for common LMS platform issues | Provide practical troubleshooti ng workshops andpeer support groups | Troubleshootin g workshop for LMS common issues Formationof peer troubleshooting support teams Develop troubleshooting guidebooks and FAQs | Teachers, ICTStaff, Supervisors | May 2028 | Trainer fees: 6,000 Materials and printouts: 3,000 Logistics: 3,000 | 85% teachers confidently troubleshoot platform issues | |
| Promote sustained and effective platform use in lesson delivery | Implement monitoring and support mechanisms for platform use | Training on best practices for platform integration in lessons Monitoring sessions and | Teachers, Supervisors | April 2028 | Facilitator costs: 8,000 Materials and certificates: 4,000 Refreshments and logistics: | 85% consistent platform usage by teachers |
| feedback collection Recognition programfor consistent user | 3,000 | ||||||
| Equip teachers to mentor students in effective platform navigation and use | Combine training and resource development | Workshop on student guidance techniques Develop student-friendly guidesand tutorials Implement student orientation sessions | Teachers, Supervisors | March 2028 | Trainer fees: 6,000 Materials development: 3,000 Orientation logistics: 3,000 | 85% students demonstrate effective platform use | |
| Increase use of interactive features to boost learner engagement | Deliver hands-on training and practice opportunities | Workshop on interactive LMS tools Design and pilot interactive activities. Peer review and sharing of best practices | Teachers, ICT Support | February 2028 | Trainer fees: 8,000 Materials and software licenses: 4,000 Refreshments: 3,00 | 85% teachers use interactive tools regularly | |
| Improve teachers’ digital assessment and feedback capabilities | Provide dedicated trainings and practical sessions on assessment modules | Trainingon LMS assessment and feedback features Create assessment templates and rubrics Pilot assessments and feedback collection | Teachers, Supervisors | January 2028 | Trainer fees: 8,000 Materials and software: 4,000 Logistics: 3,000 | 85% teachers effectively use platform assessments | |
| Build practical skills in managing content on educational platforms | Deliver step-by-step workshops with follow-up support | Workshop on file uploading and assignment management. Hands-on practice sessions Q&Aand troubleshooting clinics | Teachers, IT Support | December 2027 | Trainer fees: 8,000 Materials and printouts: 4,000 Refreshments and logistics: 3,000 | 90% teachers proficientin managing platform content |
| Introduce and familiarize teachers with educational platform | Provide comprehensi ve orientation and walkthroughs | Orientation sessions on popular LMS platforms Demo lessons and guided exploration . Follow-up Q&A webinars | Teachers, Supervisors | November 2027 | Facilitator fees: 6,000 Materials and demo resources: 4,000 Refreshments: 2,000 | 90% teachers familiar with LMS platforms | |
| Cultivate positive mindset towards adopting new educational technologies | Conduct change management and adoption workshops | Workshops on benefits and use of new digital tools Success stories sharing Feedback and adoption support | Teachers, Supervisors | November 2027 | Workshop facilitation: 6,000 Materials printing: 4,000 Refreshments: 2,000 | 85% teachers opento adopting new tools | |
| Foster collaborative culture for optimizing platform use | Organize peer learning and support networks | Workshops on collaboration andplatform sharing techniques Establish peer-to-peer learning groups Regular sharing sessions and platform improvement planning | Teachers, Supervisors | October 2027 | Facilitator/train er fees: 8,000 Materials & coordination: 4,000 Refreshments & logistics: 3,000 | 90%active collaboration toimprove platform use | |
| 7. Digital Survival Skills | Enhance teachers' ability to promptly resolve digital issues during lessons | Deliver hands-on, scenario-based problem-solving training | Conduct real-time troubleshooting simulation workshops Develop quick-reference problem-solving guides Createpeer support structures for immediate assistance | Teachers, Supervisors, IT Staff | June 2028 | Trainer fees: 8,000 Materials and guides: 4,000 Refreshments/ logistics: 3,000 | 80% teachers demonstrate real-time problem-solving skills |
| Improve operational efficiency of teachers in | Provide integrated digital skills training | Workshop on online teaching platforms and | Teachers, Supervisors | May 2028 | Facilitator fees: 8,000 Training | 85%show improved efficiencyin digital tasks |
| digital teaching and admin roles | combining teaching and admin software | administrative software Hands-on exercises managing digital classroom and admin tasks Feedback and process improvement sessions | materials: 4,000 Refreshments and logistics: 3,000 | ||||
| Build capacity in workload management with digital productivity tools | Conduct workshops ondigital organizers andtask trackers | Training on use ofdigital calendars, planners, and task management apps Develop personalized workload management plans Peer sharing of workload management tips | Teachers, Supervisors | May 2028 | Facilitator fees: 6,000 Materials and printouts: 3,000 Logistics and refreshments: 3,000 | 80% efficiently manage workload usingdigital tools | |
| Empower teachers to self-learn emerging digital tools | Provide resources and guidance promoting autonomous learning | Workshop on strategies for independent digital learning Curateand distribute self-learning resource packages . Establish mentoring and peer-check-in system | Teachers, Supervisors | April 2028 | Facilitator fees: 6,000 Resource materials: 3,000 Coordination expenses: 3,00 | 85% increase in self-led digital tool learning | |
| Improve time management and task prioritization via digital applications | Organize practical workshops and follow-up coaching | Hands-on time management tool sessions . Creationof individual digitaltask schedules Regular progress | Teachers, Supervisors | March 2028 | Trainer fees: 6,000 Materials and software access: 4,000 Refreshments: 2,000 | 85% demonstrate improved time task management |
| reviewsand coaching | |||||||
| Enhance resilience and problem management in digital environments | Facilitate seminars andpeer support forums | Seminaron managing tech challenges calmly Peer discussion groups sharing coping strategies Development of a challenge-response resource toolkit | Teachers, Supervisors | March 2028 | Facilitator fees: 5,000 Materials and printouts: 3,000 Logistics and refreshments: 2,000 | 80% teachers maintain teaching despite tech issues | |
| Build emotional and professional resilience amid tech changes | Deliver resilience-building workshops | Workshops in stress management and adaptability. Peer support circle formation Periodic resilience assessments and feedback | Teachers, Supervisors | February 2028 | Trainer fees: 5,000 Materials: 3,000 Meeting logistics: 2,000 | 85% teachers report increased resilience | |
| Encourage ongoing digital skills development through PD programs | Organize continuous learning opportunities | Schedule regular digital skillsPD sessions Facilitate certifications or badges programs MonitorPD participation and impact | Teachers, Supervisors | February 2028 | Trainer fees: 6,000 Materials and certification fees: 4,000 Administration costs: 2,000 | 90% teachers participate in PD activities | |
| Equip teachers to anticipate and adapt to emerging technologies | Conduct foresight and innovation workshops | Workshops on digital trend awareness Discussion forumson future-proofing teaching Development of innovation action plans | Teachers, Supervisors | January 2028 | Facilitator fees: 6,000 Materials and discussion guides: 4,000 Logistics and refreshments: 2,000 | 85% teachers integrate future trends awareness | |
| Build capacity to sustain teaching quality | Deliver contingency planning and | Trainingon alternative | Teachers, Supervisors | January 2028 | Trainer fees: 6,000 | 85% maintain teaching quality despite |
| despite tech issues | management trainings | teaching strategies. Create contingency plans for tech failures Conduct simulation drills | Materials and templates: 4,000 Drill logistics: 2,000 | tech failures | |||
| 8. Digital Literacy | Build foundational troubleshooting skills for hardware/softw are issues | Conduct practical troubleshooti ng training and support groups | Troubleshootin g workshops with hands-on sessions Develop quick guidesfor common problems Set up peer-support troubleshooting teams | Teachers, Supervisors, IT Staff | June 2028 | Facilitator fees: 6,000 Materials and printouts: 3,000 Refreshments and logistics: 3,00 | 85% teachers ableto troubleshoot minortech problems |
| Improve teacher knowledge on essential digital concepts | Provide seminars and tutorials on key digital literacy topics | Workshop on cloud storage, cybersecurity, and updates Interactive Q&Aand demonstrations Developand distribute concept reference material | Teachers, Supervisors | May 2028 | Trainer fees: 6,000 Materials: 3,000 Logistics and refreshments: 3,000 | 80% demonstrate knowledge of fundamental digital concepts | |
| Enhance ability to locate credible and useful online resources | Conduct training on advanced search techniques and evaluation | Workshop on advanced search strategies Practice exercises using search engines Evaluation of search results relevance and credibility | Teachers, Supervisors | April 2028 | Facilitator fees: 8,000 Materials and printouts: 4,000 Refreshments: 3,000 | 85% teachers proficientin advanced internet research | |
| Develop critical evaluation skills of online content | Provide workshops and analysis exercises on source evaluation | Workshop on evaluating online information quality . | Teachers, Supervisors | April 2028 | Trainer fees: 6,000 Materials and checklists: 3,000 | 85% accurately evaluate source credibility |
| Group exercises assessing sample sources Development of evaluation checklists | Logistics: 3,000 | ||||||
| Encourage continuous digital learning and skills upgrading | Facilitate awareness sessions and provide learning resources | Orientation on available digital learning opportunities. Establish self-learning support groups Regular feedback and motivation session | Teachers, Supervisors | March 2028 | Facilitator fees: 6,000 Materials and resource curation: 3,000 Refreshments: 3,00 | 90%active participation in continuous learning | |
| Promote effective digital file and resource management | Conduct practical sessions on digital organization toolsand techniques | Workshop on digitalfiling systemsand tagging Hands-on organization of teaching materials. Peerreview andsystem improvement | Teachers, Supervisors | March 2028 | Facilitator fees: 6,000 Materials and printouts: 3,000 Logistics and refreshments: 3,000 | 85% maintain organized digital resources | |
| Improve independent digital instruction-following skills | Provide self-guided learning workshops and resource access | Workshop on interpreting digital tutorials and manuals Practice assignments following digital instructions. Assessment and feedback session | Teachers, Supervisors | Feb 2028 | Trainer fees: 8,000 Materials and assignments: 4,000 Refreshments and logistics: 3,00 | 90% demonstrate competent independent learning | |
| Build practical digital communication and scheduling skills | Deliver hands-on training with school communicati onand calendar platforms | Workshop on emailand calendar management. Exercises in scheduling and communication . | Teachers, Supervisors | Feb 2028 | Facilitator fees: 8,000 Platform access and materials: 4,000 Logistics and refreshments: | 90% proficient indigital communicatio n tools |
| Monitoring and coaching on platform use | 3,00 | ||||||
| Strengthen fundamental digital device operation skills | Provide comprehensi ve, hands-on device operation trainings | Workshop on operating computers and tablets. Simulated digitaltask exercises Competency assessment exercises | Teachers, Supervisors | January 2028 | Trainer fees: 10,000 Equipment and materials: 5,000 Refreshments: 3,000 | 95% demonstrate proficiency in device operation | |
| Enhance skills in productivity software relevant for teaching tasks | Conduct practical software training and application workshops | Training on MS Officeand Google Workspace tools Tasks involving lesson preparation and reporting Peer feedback and mastery checks | Teachers, Supervisors | January 2028 | Facilitator fees: 10,000 Software licenses and materials: 5,000 Logistics and refreshments: 3,00 | 95% proficient in productivity software | |
| 9. Adaptability to Emerging Technologies | Improve teachers’ flexibility in incorporating diverse digital tools | Provide workshops on exploring and utilizing alternative digital resources | Workshop on various alternative digital tools and platforms Collaborative lessonplan development using alternative resources. Peer sharing and feedback session | Teachers, Supervisors | June 2028 | Facilitator fees: 6,000 Materials and printouts: 3,000 Refreshments and logistics: 3,00 | 80% demonstrate flexibility in using alternative tools |
| Build teacher confidence in experimenting with new technologies | Conduct confidence-building workshops and hands-on exploration sessions | Orientation on unfamiliar digital tools Hands-on practiceand trials Reflection and confidence self-assessment | Teachers, Supervisors | May 2028 | Trainer fees: 6,000 Materials and aids: 3,000 Logistics and refreshments: 3,000 | 85% report increased confidence exploring new tech |
| Empower teachers to motivate students in digital technology use | Conduct training on student engagement and guidance for emerging tech | Workshops on strategiesto encourage students Development ofstudent-focused digital activities Implementation and monitoring of student engagement | Teachers, Supervisors | April 2028 | Facilitator fees: 8,000 Materials and activity guides: 4,000 Refreshments and logistics: 3,00 | 85% of teachers engage students in emerging tech | |
| Enhance adaptability in instructional approaches with new technologies | Provide training on instructional design with new digital tools | Workshops on adapting teaching methods Developing digital lesson plans Peerreview and coaching onmethod adjustment | Teachers, Supervisors | March 2028 | Trainer fees: 8,000 Materials and materials printing: 4,000 Logistics and refreshments: 3,00 | 85% demonstrate method adjustment to new tools | |
| Improve rapid adaptability to tech changes in school operations | Conduct scenario-based training and change management | Scenario workshops on techchange adaptation. Problem-solving exercises Follow-up reviewsand best practice sharing | Teachers, Supervisors | February 2028 | Facilitator fees: 6,000 Materials and printouts: 3,000 Refreshments: 3,00 | 85% adjust rapidly to tech changes | |
| Promote ongoing digital skills enhancement | Facilitate continuous professional development programs | Schedule digital skills PD workshops Encourage certification andonline learning. MonitorPD progress and document growth | Teachers, Supervisors | February 2028 | Trainer fees: 6,000 Materials and certification fees: 4,000 Administrative support: 2,000 | 90% participation in ongoing digital PD | |
| Increase preparedness for adopting new instructional technologies | Provide introductory training and implementati on support | Introductory workshops on new tools. Guided implementation | Teachers, Supervisors | February 2028 | Trainer fees: 6,000 Materials and printouts: 3,000 | 85% ready and able to implement new tech |
| ofnew software/hardw are Feedback and troubleshooting support | Follow-up logistics: 3,000 | ||||||
| Strengthen positive attitudes towards technology adoption | Conduct change management and benefits awareness sessions | Workshops on benefits and use of new technologies Share success stories Organize feedback and support groups | Teachers, Supervisors | January 2028 | Facilitator fees: 6,000 Materials and communicatio ns: 4,000 Refreshments: 2,000 | 90% show willingness to adopt new tech | |
| Encourage active participation in technology-related PD | Conduct engagement and motivation seminars | Seminars promoting PD benefits Facilitate PD access and scheduling Track participation andshare incentives | Teachers, Supervisors | January 2028 | Facilitator fees: 6,000 Materials and incentives: 4,000 Administrative costs: 2,000 | 90% engaged in tech PD opportunities | |
| Cultivate a positive mindset on tech-driven reforms | Provide inspirational and change readiness activities | Workshops on the value of reforms Success stories and role model presentations. Feedback and action planning | Teachers, Supervisors | January 2028 | Facilitator fees: 6,000 Materials and presentations: 4,000 Refreshments and logistics: 2,000 | 90% positive attitude on reforms | |
| 10.Data Management Preservation | Build teacher capacity to train peers on proper data handling | Conduct training-of-trainers and peer coaching sessions | Training-of-trainers on data management procedures Peer coaching and mentoring sessions. Development and distribution ofdata management guide | Teachers, Supervisors | June 2028 | Facilitator fees: 6,000 Materials and printouts: 3,000 Refreshments and logistics: 3,000 | 80% of designated trainers proficient; 70% teachers trained |
| Encourage routine evaluation and | Trainon audit procedures | Workshop on data | Supervisors, ICT Coordinators | May 2028 | Trainer fees: 6,000 | 85% schools conduct regular data |
| updating of data systems | and system improvement planning | organization reviews Develop review and update schedules Implementation of periodic audits and reporting | , Teachers | Materials and templates: 3,000 Refreshments: 3,000 | reviews | ||
| Strengthen secure data storage habits to prevent data loss | Conduct secure storage awareness and technical trainings | Workshop on best practices for secure storage. Implementation ofsecure storage protocols Technical supportand compliance check | ICT coordinators, Teachers, Supervisors | May 2028 | Facilitator fees: 8,000 Storage solution materials: 4,000 Logistics and refreshments: 3,000 | 90% compliance with secure storage protocols | |
| Improve document control and versioning of digital resources | Train teachers on version control tools and practices | Workshop on version control systems (e.g., Google Drive versions) Hands-on practical sessions Monitoring version control implementation | Teachers, Supervisors | April 2028 | Trainer fees: 6,000 Materials and tutorial guides: 3,000 Refreshments: 3,000 | 85% of teachers implement version control | |
| Promote effective digital filing and organized data handling | Conduct file management workshops and develop guidelines | Trainingon organizing digital records Developing and applying filing systems Peer consultations and feedback | Teachers, Supervisors | March 2028 | Facilitator fees: 8,000 Materials and printouts: 4,000 Logistics and refreshments: 3,000 | 90% maintain organized digital records | |
| Enhance skills in digital data monitoring platforms | Provide training and practice on monitoring software | Workshop on data monitoring tools Hands-on data tracking exercises | Teachers, Supervisors | March 2028 | Trainer fees: 8,000 Software/tools access: 4,000 Logistics and refreshments: 3,000 | 85% effectively use data monitoring tools |
| Reviewand feedbackon monitoring | |||||||
| Ensure routine data backup to prevent loss | Trainon backup procedures and schedule development | Workshop on backup methods Development ofbackup schedules Monitoring backup completion | ICTStaff, Teachers, Supervisors | February 2028 | Facilitator fees: 6,000 Materials and schedules: 3,000 Refreshments: 3,000 | 90% perform regular backups | |
| Improve adherence to official data policies and guidelines | Conduct compliance training and audits | Seminaron DepEddata management policies Compliance audit workshops Development of compliance checklist | Supervisors, ICT Officers, Teachers | January 2028 | Facilitator fees: 6,000 Materials and audit tools: 4,000 Logistics: 2,000 | 95% compliance with DepEd guidelines | |
| Strengthen secure storage of confidential data | Provide technical and procedural training | Workshop on data security measures . Installation and use of security software Verification and follow-up security assessments | ICTStaff, Supervisors | January 2028 | Trainer fees: 8,000 Security software/licen ses: 4,000 Refreshments and logistics: 3,000 | 95% of schools implement secure storage | |
| Ensure accuracy in digital records management | Provide specialized training on record-keeping best practices | Workshop on maintaining accurate digital records Practical exerciseson data input and verification. Continuous monitoring and quality check | Teachers, Supervisors, ICT Coordinators | January 2028 | Facilitator fees: 8,000 Materials and recording templates: 4,000 Logistics and refreshments: 3,000 | 95% maintain accurate digital records | |
| 11. Cybersecuri ty Awareness | Enhance teachers’ ability to identify suspicious digital communications | Provide hands-on training on recognizing and handling suspicious emails/links | Workshop on phishing, suspicious links, and email threats | Teachers, Supervisors, IT Staff | January 2028 | Facilitator fees: 6,000 Materials and printouts: 3,000 Refreshments | 85% accurately identify suspicious emails and links |
| Simulation activities with fake phishing emails . Development and distribution ofquick reference guides | and logistics: 3,000 | ||||||
| Build capacity in effectively reporting cybersecurity incidents | Conduct training on incident reporting procedures and tools | Workshop on schoolcyber incident reporting protocols Developand distribute reporting forms/template s Mock drills on incident reporting and response | Teachers, ICT Officers, Supervisors | May 2028 | Trainer fees: 6,000 Materials and templates: 3,000 Logistics and refreshments: 3,000 | 85% report cyber threats according to protocols | |
| Enable teachers to educate students on cyber safety principles | Provide training and resource development for student cyber safety | Workshop on cybersafety topicsfor students Develop student-friendly cybersafety materials Implementation of cyber safety sessions in classes | Teachers, Supervisors | April 2028 | Facilitator fees: 8,000 Materials and brochures: 4,000 Refreshments and logistics: 3,000 | 85% teachers conduct regular cyber safety lessons | |
| Strengthen data privacy and confidentiality management | Conduct seminars on handling sensitive information securely | Training on privacy policies and secure data handling Practical exercisesin data protection Development ofdata handling protocols | Teachers, Supervisors | March 2028 | Facilitator fees: 8,000 Materials and printouts: 4,000 Logistics and refreshments: 3,000 | 90% follow proper sensitive data handling practices | |
| Improve understanding and compliance with DepEd cybersecurity policies | Offer policy-focused awareness sessions | Workshop on DepEdICT security policies | Teachers, Supervisors | February 2028 | Facilitator fees: 6,000 Materials distribution: 3,000 | 90% demonstrate awareness and compliance |
| Reviewand discussion sessions Distribution of policy documents and compliance checklists | Refreshments: 3,000 | ||||||
| Promote responsible and secure digital sharing practices | Provide practical trainings and guidelines on file sharing | Trainingon secureand responsible digital sharing Develop sharing guidelines and checklists Monitor sharing practices and provide feedback | Teachers, Supervisors | January 2028 | Trainer fees: 6,000 Materials and checklists: 3,000 Logistics: 3,000 | 90% adhere to responsible sharing standards | |
| Enhance security through proper password and authentication use | Conduct security best practices workshops | Workshop on creating strong passwords and multi-factor authentication Password management tool demonstrations Follow-up compliance checks | Teachers, ICT Staff | January 2028 | Trainer fees: 8,000 Materials and tool access: 4,000 Refreshments and logistics: 3,000 | 95% implement strong password practices | |
| Ensure secure and responsible use of devices in work settings | Provide comprehensi vedevice usage and security training | Workshop on secure use of schooland personal devices Develop safe use guidelines Monitor adherence to safeusage policies | Teachers, Supervisors | January 2028 | Facilitator fees: 8,000 Guidelines printouts: 4,000 Logistics and refreshments: 3,000 | 95% comply with safe device usage protocols | |
| Increase knowledge of typical cybersecurity threats | Conduct awareness seminars and simulations | Awareness seminaron common threats Interactive malware and | Teachers, Supervisors | January 2028 | Trainer fees: 6,000 Materials and printouts: 3,000 Refreshments: | 90% recognize common cybersecurity threats |
| ransomware simulations Distribution of threat identification guides | 3,000 | ||||||
| Promote routine software and system updates for security | Trainon update procedures and scheduling | Workshop on importance and procedures of software updates Create update schedules and reminders. Monitor update compliance | Teachers, ICT Coordinators | January 2028 | Trainer fees: 6,000 Materials and schedules: 3,000 Logistics and refreshments: 3,000 | 85% maintain updated software and systems | |
| 12. Digital Communica tion Skills | Improve conflict resolution and clarification skills in digital communications | Conduct training and role-playing scenarios on effective digital conflict management | Workshop on digital conflict resolution techniques Role-playing exercises with real-life scenarios. Peer feedback and reflective sessions | Teachers, Supervisors | June 2028 | Facilitator fees: 6,000 Materials and printouts: 3,000 Logistics and refreshments: 3,00 | 80% demonstrate improved digital conflict resolution skills |
| Enhance clarity and precision in written digital communications | Provide hands-on workshops and writing exercises | Trainingon effective digital writing techniques Exercises on drafting clear messages and emails. Peerreview and feedback on communication samples | Teachers, Supervisors | May 2028 | Trainer fees: 6,000 Materials and exercises: 3,000 Refreshments and logistics: 3,000 | 85% show improved clarity in digital communicatio ns | |
| Strengthen record-keeping and archiving skills for digital communications | Provide practical training on systematic documentati onand archiving | Workshop on digital archiving tools and best practices Develop personal and school archiving systems | Teachers, Supervisors | April 2028 | Facilitator fees: 6,000 Materials and templates: 3,000 Logistics and refreshments: 3,000 | 85% maintain proper archival of communicatio ns |
| Monitoring and compliance checks | |||||||
| Improve teacher skills in clear digital instruction delivery | Conduct training on instructional writing and multimedia communicati on | Workshops on crafting clear digital instructions Development of multimedia-supported learning guides. Classroom implementation andpeer feedback | Teachers, Supervisors | March 2028 | Trainer fees: 8,000 Materials and multimedia aids: 4,000 Refreshments and logistics: 3,000 | 85% effectively convey instructions digitally | |
| Promote timely responses to digital correspondence | Provide awareness sessions and time management techniques | Workshop on professional responsivenes s and time management Set response time guidelines Monitoring and feedback sessions | Teachers, Supervisors | March 2028 | Facilitator fees: 6,000 Materials and monitoring tools: 3,000 Logistics: 3,000 | 85% demonstrate timely responsivenes s | |
| Foster respectful and professional digital interaction | Conduct etiquette and professionali sm workshops | Training on digital etiquette and tone Practice exercises and role-playing Peerand supervisor feedback | Teachers, Supervisors | March 2028 | Trainer fees: 6,000 Materials and practice guides: 3,000 Logistics and refreshments: 3,00 | 90% maintain proper digital etiquette | |
| Enhance digital collaboration and coordination capabilities | Provide training on collaboration toolsand teamwork strategies | Workshop on digital collaboration platforms (e.g., MSTeams, Google Workspace) Group coordination task exercises . Peer evaluation and reflection | Teachers, Supervisors | February 2028 | Facilitator fees: 8,000 Materials and platform access: 4,000 Refreshments and logistics: 3,00 | 90% demonstrate effective digital collaboration |
| Improve utilization of digital tools for school communication | Conduct practical training and usage monitoring | Workshop on communication tool functionalities . Create announcement and reminder templates Monitor usage andprovide feedback | Teachers, Supervisors | February 2028 | Trainer fees: 8,000 Materials and templates: 4,000 Logistics and refreshments: 3,00 | 90% regularly use communicatio n tools effectively | |
| Strengthen professional digital communication etiquette and use | Deliver comprehensi vetraining andpolicy awareness | Workshop on professional communication norms Platform walkthroughs andbest practice sharing Compliance monitoring and coaching | Teachers, Supervisors | January 2028 | Facilitator fees: 8,000 Materials and policy handouts: 4,000 Logistics and refreshments: 3,00 | 95% demonstrate professional communicatio n use | |
| Improve teamwork and coordination through digital means | Conduct practical collaboration exercises and trainings | Trainingon coordination toolsand techniques Group digital projects Feedback and reflection sessions | Teachers, Supervisors | January 2028 | Trainer fees: 6,000 Materials and collaboration aids: 3,000 Refreshments: 3,000 | 85% improve digital collaboration skills | |
| 13. Digital Ethics and Responsibili ty | Enhance teacher awareness and practices in maintaining integrity during online assessments | Conduct training on online assessment integrity and monitoring | Workshop on integrity issues indigital assessments. Develop guidelines and monitoring tools Implementation and feedback sessions | Teachers, Supervisors | June 2028 | Facilitator fees: 6,000 Materials and printouts: 3,000 Refreshments and logistics: 3,000 | 85% maintain integrity in online assessments |
| Increase awareness of legal risks related to unethical digital behavior | Conduct seminars on legal implications and responsibiliti es | Awareness seminaron digital laws and ethics Casestudy discussions | Teachers, Supervisors | May 2028 | Trainer fees: 6,000 Materials and brochures: 3,000 Logistics and | 90% aware of legal consequences |
| Distribution of legal consequence guides | refreshments: 3,000 | ||||||
| Foster adherence to ethical standards in online interactions | Provide workshops onethical online behavior | Workshop on ethical standards and expected behaviors Role-playing ethical dilemmas Development ofethical guidelines for school | Teachers, Supervisors | April 2028 | Facilitator fees: 6,000 Materials and handouts: 3,000 Refreshments: 3,000 | 85% adhere to ethical online behaviors | |
| Equip teachers to promote responsible digital citizenship among learners | Conduct training and develop student-focused materials | Workshop on digital citizenship concepts Creationof student teaching materials. Implementation of classroom sessions | Teachers, Supervisors | April 2028 | Facilitator fees: 8,000 Materials and student guides: 4,000 Refreshments and logistics: 3,000 | 85% conduct digital citizenship lessons | |
| Improve teacher knowledge and skills to avoid digital plagiarism | Provide training and toolson plagiarism awareness and prevention | Workshop on plagiarism detection and prevention Introduce use of plagiarism software/tools Develop plagiarism policyfor school | Teachers, Supervisors | March 2028 | Trainer fees: 6,000 Materials and software access: 3,000 Logistics and refreshments: 3,000 | 90% avoid plagiarism in content | |
| Promote culture of ethical technology use among staff and learners | Organize advocacy andpeer mentoring programs | Advocacy workshops on ethical use Peermentor training sessions Regular ethical technology campaign | Teachers, Supervisor | March 2028 | Facilitator fees: 6,000 Materials and campaign tools: 3,000 Refreshments and logistics: 3,000 | 85% participate in ethical use promotion | |
| Enhance compliance with copyright in digital resource | Conduct compliance training and resource | Workshop on copyright laws | Teachers, Supervisors | March 2028 | Trainer fees: 6,000 Materials and | 90% comply with copyright laws |
| sharing | audits | and compliance Resource sharing audits Develop checklistfor copyright compliance | audit tools: 3,000 Logistics: 3,000 | ||||
| Foster responsible behavior on social media and digital platforms | Provide awareness training and usage guidelines | Workshop on responsible socialmedia use Develop usage guidelines Monitor adherence and feedback | Teachers, Supervisors | February 2028 | Facilitator fees: 6,000 Materials and guidelines: 3,000 Logistics and refreshments: 3,000 | 90% responsible use of social media | |
| Encourage teachers to serve as role models for ethical digital conduct | Organize leadership and modeling workshops | Trainingon leadingby examplein digital ethics Sharing success stories androle models Recognition of exemplary digital behavior | Teachers, Supervisors | January 2028 | Trainer fees: 6,000 Materials and recognitions: 4,000 Refreshments and logistics: 2,000 | 95% teachers model ethical behavior | |
| Ensure respect for IP rights among educators | Provide training on intellectual property and appropriate usage | Workshop on intellectual property rights and laws DistributeIP compliance guides Monitor resource use for IP respect | Teachers, Supervisors | January 2028 | Facilitator fees: 6,000 Materials and guides: 4,000 Logistics and refreshments: 2,000 | 95% respect IP rights in digital use |
| Key Result Areas | Objective | Strategy | Activities | Person Involved | Time Frame | Budget | Performanc e Indicators |
| B. PROFESSIONAL COLLABORATION AND ADMINISTRATIVE SUPPORT | |||||||
| 1. Instructional Leadership and Supervisory Support | Enhance supervisors’ skillsin classroom observation and feedback | Conduct training on effective classroom monitoring and feedback | Workshop on classroom observation techniques | Supervisors, School Heads | June 2028 | Facilitator fees: 6,000 Materials and observation tools: 3,000 | 85% supervisors improve observation & feedback quality |
| Practice observation sessions Feedback and reflection meetings. | Logistics and refreshments: 3,000 | ||||||
| Strengthen supervisory supportin addressing classroom challenges | Facilitate problem-solving workshops and support networks | Workshops on classroom challenge resolution Establishment ofsupport groups Follow-up coaching and case reviews | Supervisors, School Heads, Teachers | May 2028 | Trainer fees: 6,000 Materials and guides: 3,000 Meeting logistics: 3,000 | 85%report effective supportfor classroom issues | |
| Promotea cultureof instructional innovation supportedby leadership | Conduct motivation andbest practice sharing workshops | Workshops encouraging innovative teaching Best practice sharing sessions Recognition of innovative efforts | School Heads, Supervisors, Teachers | April 2028 | Facilitator fees: 8,000 Materials and certificates: 4,000 Refreshments and logistics: 3,000 | 85% teachers feel supported to innovate | |
| Improve clarity in communicating school policies | Provide communicati onskills training for supervisors | Workshop on policy communication . Develop communication action plans Regular monitoring and feedback | Supervisors, School Heads | April 2028 | Facilitator fees: 6,000 Materials and printouts: 3,000 Logistics and refreshments: 3,00 | 90% supervisors communicate policies clearly | |
| Expandand strengthen professional development opportunities | Organize and monitor PD programs | Identify training needs and schedule PD Conduct workshops and seminars Monitorand evaluatePD outcomes | School Heads, Supervisors | March 2028 | Coordinator fees: 8,000 Venue and materials: 4,000 Refreshments and logistics: 3,00 | 85% participate in PD programs | |
| Support teachersin curriculum alignment | Conduct workshops and coaching onlesson | Trainingon curriculum standards | Supervisors, School Heads, Teachers | March 2028 | Facilitator fees: 8,000 Curriculum | 90% lesson plans aligned with standards |
| planning | Collaborative lessonplan development Reviewand feedback sessions | guides/materia ls: 4,000 Logistics and refreshments: 3,000 | |||||
| Improve the timeliness and quality of feedback | Train supervisors on feedback techniques and scheduling | Workshop on constructive feedback delivery Establish feedback schedules Monitor feedback qualityand frequency | Supervisors, School Heads | February 2028 | Trainer fees: 8,000 Materials and monitoring tools: 4,000 Logistics and refreshments: 3,00 | 90% receive timely instructional feedback | |
| Strengthen leadership in cultivating a positive school climate | Provide leadership development programs | Leadership workshops on school climate Action planning sessions Implementation support and monitoring | School Heads, Supervisors | January 2028 | Facilitator fees: 8,000 Planning tools and materials: 4,000 Refreshments and logistics: 3,000 | 90% leaders foster positive environment | |
| Promote recognition and motivation | Develop and implement recognition programs | Establish recognition criteria Organize award ceremonies Monitor impact on motivation | School Heads, Supervisors | January 2028 | Facilitator fees: 6,000 Awards and materials: 4,000 Event logistics: 2,000 | 90% motivated by recognition | |
| Expand mentorship programs | Train mentors and organize mentoring activities | Mentor training sessions Organize mentoring schedules Monitor mentoring impact | Supervisors, School Heads, Experienced Teachers | February 2028 | Facilitator fees: 8,000 Materials and guides: 4,000 Logistics and refreshments: 3,000 | 85% teachers supported through mentorship | |
| 2. Recognition , Motivation, andWell-Being Support | Improve teacher well-being through dedicated wellness programs | Organize wellness seminars and counseling services | Conduct wellness seminars focusingon stress management and self-care | Teachers, Supervisors, Guidance Counselors | June 2028 | Facilitator fees: 6,000 Materials and handouts: 3,000 Refreshments | 80% participate in well-being programs |
| Provide access to counseling and support services Establish peer support groups | and logistics: 3,000 | ||||||
| Strengthen recognitionof staff collaborative efforts | Implement recognition programs and reward systems | Develop criteriafor collaborative contribution recognition Organize awardand recognition events Provide certificates and tokensof appreciation | School Heads, Supervisors | May 2028 | Facilitator fees: 6,000 Award materials and certificates: 3,000 Event logistics: 3,00 | 85% receive recognition for contributions | |
| Motivate personnelvia incentives and awards for excellence | Develop and implement incentive schemes | Establish incentive policies Organize quarterlyor annual awards Publicize achievements to boost morale | School Heads, Supervisors | April 2028 | Facilitator fees: 8,000 Incentive materials and awards: 4,000 Logistics and refreshments: 3,000 | 85% motivated by incentive programs | |
| Encourage innovation through positive feedbackand rewards | Provide platforms for showcasing and rewarding innovation | Workshops to promote innovative teaching Recognition eventsfor effective practices Feedback forumsand peer acknowledgem ents | Supervisors, School Heads, Teachers | April 2028 | Facilitator fees: 8,000 Materials and recognition items: 4,000 Refreshments and logistics: 3,000 | 85%feel positively reinforced for innovation | |
| Provide emotional support in times of stress and challenge | Establish counseling andpeer encouragem ent systems | Counseling sessions and mental health awareness Peer support circles and buddy systems | Teachers, Supervisors, Counselors | March 2028 | Facilitator fees: 6,000 Materials and counseling aids: 3,000 Logistics and refreshments: 3,000 | 85%report receiving emotional support |
| Regular check-insby supervisors | |||||||
| Cultivatea positiveand motivating workplace culture | Implement team- building activities and feedback mechanisms | Organize team-building workshops. Develop feedback and suggestion systems Regular motivational sessions and events | School Heads, Supervisors, Teachers | March 2028 | Facilitator fees: 8,000 Materials and workshop costs: 4,000 Refreshments and logistics: 3,00 | 85% report increased job satisfaction | |
| Establish policiesto promotewell- beingand reducework stress | Develop and enforce well-being policies | Draftand disseminate stress reduction policies Conduct awareness sessions Monitor policy adherence and impact | School Heads, Supervisors | February 2028 | Facilitator fees: 6,000 Materials and policy documents: 3,000 Logistics: 3,000 | 85%policy implementatio n compliance | |
| Institutionalize recognitionof achievements | Schedule and conduct regular recognition programs | Monthlyor quarterly recognition ceremonies Development of recognition systems Public communication s highlighting achievements | School Heads, Supervisors | February 2028 | Facilitator fees: 8,000 Materials and certification: 4,000 Event logistics: 3,000 | 90% receive regular acknowledgm ent | |
| Promote ongoing professional development opportunities | Facilitate training, seminars, and workshops | Identify training needs and opportunities Organize relevant workshops and seminars Track participation and outcomes | School Heads, Supervisors, Teachers | January 2028 | Coordinator fees: 8,000 Training materials and venue: 4,000 Refreshments and logistics: 3,000 | 90% engage in professional growth activities | |
| Encourage and implement policies that foster work-life balance | Develop programs and awareness campaign | Workshops on work-life balance importance | School Heads, Supervisors | January 2028 | Facilitator fees: 8,000 Materials and campaigns: | 90%report improved work-life balance |
| Implementation offlexible schedules and support programs Monitoring and evaluation | 4,000 Logistics and refreshments: 3,00 | ||||||
| 3. Collaborativ e Planning and Teamwork | Strengthen skills in giving and receiving constructive peer feedback | Conduct training on effective feedback and communicati on | Workshop on giving constructive feedback Role-playing andpeer review sessions Reflection and improvement planning | Teachers, Supervisors | June 2028 | Facilitator fees: 6,000 Materials and handouts: 3,000 Refreshments and logistics: 3,000 | 85% demonstrate effective peer feedback skills |
| Promote collaborative project planning across disciplines | Facilitate project planning workshops andteam-building exercises | Workshop on interdisciplinar y project design Team-building activities Collaborative project planning sessions | Teachers, Supervisors, School Heads | May 2028 | Facilitator fees: 8,000 Materials and planning tools: 4,000 Logistics and refreshments: 3,000 | 85% engage in joint project development | |
| Enhance collaborative problem-solving capacities | Facilitate group problem-solving trainings and workshops | Workshop on collective problem-solving approaches Scenario analysisand group discussions Implementation of solutions and feedback | Teachers, Supervisors | May 2028 | Trainer fees: 8,000 Materials and case studies: 4,000 Refreshments and logistics: 3,000 | 85% participate in collective problem-solving | |
| Improve coordination of teacher schedules and lesson plans | Organize planning sessions and training on schedule management | Workshops on scheduling and lesson coordination Develop coordinated planning calendars. Regular review meetings | Teachers, Supervisors, School Heads | April 2028 | Facilitator fees: 6,000 Materials and calendars: 3,000 Logistics and refreshments: 3,000 | 85% coordinate schedules effectively |
| Foster culture of resource sharing among educators | Provide platforms and sessions for sharing teaching materials | Trainingon digitaland physical resource sharing Establish resource sharing platforms/cente rs Organize collaborative sharing forums | Teachers, Supervisors | March 2028 | Trainer fees: 8,000 Materials and platforms: 4,000 Logistics and refreshments: 3,000 | 85% actively share instructional resources | |
| Encourage peer support during busy times | Organize support networks and recognition programs | Workshop on peer support strategies Create support groups for special projects Recognize collaborative support | Teachers, Supervisors | March 2028 | Facilitator fees: 6,000 Materials and recognition items: 3,000 Logistics and refreshments: 3,000 | 85% actively support colleagues | |
| Promote inclusivity and respect in collaborative planning | Conduct diversity and inclusion workshops | Training on valuing diverse perspectives Inclusive planning exercises Reflection and feedback sessions | Teachers, Supervisors | February 2028 | Trainer fees: 6,000 Materials and handouts: 3,000 Logistics and refreshments: 3,000 | 90% incorporate diverse perspectives | |
| Expand peer mentoring and co-teaching collaboration | Organize mentoring programs and collaborative teaching arrangement s | Mentor training and selection Schedule co-teaching sessions Monitoring and evaluation of outcomes | Teachers, Supervisors, School Heads | February 2028 | Facilitator fees: 8,000 Materials and guides: 4,000 Logistics and refreshments: 3,000 | 90% participate in mentoring/co-teaching | |
| Enhance communication skills within teams | Provide communicati onskills training and facilitation | Workshops on effective team communication . Team communication exercises Feedback and improvement sessions | Teachers, Supervisors | February 2028 | Trainer fees: 6,000 Materials and exercises: 3,000 Logistics and refreshments: 3,000 | 90%show improved team communicatio n |
| Increase active engagement in planning sessions | Facilitate effective planning meetings and engagement strategies | Trainingon effective participation Facilitate planning sessions Monitor attendance and engagement | Teachers, Supervisors, School Heads | January 2028 | Facilitator fees: 8,000 Meeting materials: 4,000 Logistics and refreshments: 3,000 | 95% active participation in planning | |
| 4. Communica tionand Decision-Making Support | Enhance supervisors’ supportfor teachers’ instructional decisions | Provide training and establish support frameworks | Workshop on decision-making support techniques. Establish supervisory support teams Conduct follow-up coaching and feedback sessions | Supervisors, Teachers, School Heads | June 2028 | Facilitator fees: 6,000 Materials and tools: 3,000 Refreshments and logistics: 3,00 | 85% teachers receive effective supervisory support |
| Improve school leaders’ accessibility for staff consultation | Implement open-door policies and consultation schedules | Policy development forleader accessibility Schedule regular consultation hours Monitor consultation | School Heads, Supervisors | June 2028 | Facilitator fees: 6,000 Materials and scheduling tools: 3,000 Logistics and refreshments: 3,000 | 85%report increased accessibility to leaders | |
| Strengthen two-way communication channelsfor feedback | Develop and implement feedback systems | Setup anonymous suggestion boxes/digital platforms Conduct trainingon givingand receiving feedback Regularly review and act onfeedback collected | Teachers, Supervisors, School Heads | May 2028 | Facilitator fees: 6,000 Materials and platform setup: 3,000 Logistics and refreshments: 3,000 | 85% actively use feedback mechanisms | |
| Enhance transparency in school governance | Conduct awareness andpolicy communicati on workshops | Workshops on transparent communication Publication of policies and updates | School Heads, Supervisors | April 2028 | Facilitator fees: 6,000 Materials and publications: 3,000 | 90% perceive transparent implementatio n |
| Monitoring policy dissemination | Logistics and refreshments: 3,000 | ||||||
| Increase staff involvement in school decision-making | Facilitate inclusive decision-making practices | Organize participatory decision-making workshops Establish committees for instructional/ad ministrative decisions Monitor participation and impact | Teachers, Supervisors, School Heads | April 2028 | Facilitator fees: 6,00 Materials and committee support: 3,000 Logistics and refreshments: 3,000 | 85% participate in decision-making | |
| Foster an open communication culture | Provide communicati onskills training and forums | Workshops on open communication and psychological safety. Initiate open forums for idea sharing Collect and act on suggestions | Teachers, Supervisors | April 2028 | Facilitator fees: 6,000 Materials and forums logistics: 3,000 Refreshments: 3,000 | 85% feel free to express ideas | |
| Ensure prompt communication ofschool changes | Establish efficient communicati on protocols | Develop communication guidelines and protocols Train staff on timely information dissemination Monitor communication timeliness and effectiveness | School Heads, Supervisors | March 2028 | Facilitator fees: 6,000 Materials and checklists: 3,000 Logistics and refreshments: 3,000 | 90% receive timely communicatio n | |
| Improve clarity in school-wide information dissemination | Provide training on effective communicati on channels | Workshops on clear communication practices Use of multiple communication platforms Monitor message clarityand reach | School Heads, Supervisors | February 2028 | Trainer fees: 8,000 Materials and communicatio n tools: 4,000 Refreshments and logistics: 3,00 | 90% clarity in announcemen ts and policies |
| Optimize communication through meetingsand digital tools | Conduct training and implement communicati onbest practices | Trainingon effective meetings and digital communication Develop templates for memosand announcement s Monitor communication efficiency | Teachers, Supervisors, School Heads | January 2028 | Facilitator fees: 8,000 Materials and digital tool access: 4,000 Logistics and refreshments: 3,000 | 95% efficient communicatio nusing available platforms | |
| Clarify staff rolesin decision-making to improve participation | Define and communicat erole expectations | Workshops on rolesand responsibilities Distribution of role descriptions Regular review and updates | Supervisors, School Heads, Teachers | March 2028 | Facilitator fees: 6,000 Materials and role documents: 3,000 Logistics and refreshments: 3,000 | 85% understand decision-making roles | |
| 5. Shared Vision and Goal Alignment | Promote teamwork focusedon achieving shared school goals | Facilitate collaborative planning and teamwork building activities | Workshops on collaboration forcommon goals Group planning sessions Monitoring and feedbackon collaborative efforts | Teachers, Supervisors, School Heads | June 2028 | Facilitator fees: 6,000 Materials and handouts: 3,000 Refreshments and logistics: 3,000 | 85% actively collaborate toward school targets |
| Strengthen participation in school-wide planning related to goals | Organize participatory planning sessions and training | Workshops on goal-aligned planning Facilitate planning meetings Reviewand assess planning output | Teachers, Supervisors, School Heads | May 2028 | Facilitator fees: 6,000 Materials and planning tools: 3,000 Logistics and refreshments: 3,000 | 85% engaged ingoal- focused planning | |
| Increase awareness and capacityto adapt to policy changes | Provide orientation and adaptation workshops | Training on new policies and alignment. Dissemination ofpolicy updates | Supervisors, School Heads, Teachers | May 2028 | Facilitator fees: 6,000 Materials and policy documents: 3,000 Refreshments and logistics: | 85% aware of policy changes andact accordingly |
| Support adaptation planning | 3,000 | ||||||
| Enhance involvement in trackinggoal progress | Conduct training on monitoring and evaluation processes | Workshop on goal monitoring techniques Develop tools for progress tracking Regular evaluation meetings | Teachers, Supervisors | April 2028 | Facilitator fees: 6,000 Monitoring tools and materials: 3,000 Logistics and refreshments: 3,000 | 85% actively contribute to progress monitoring | |
| Align individual teaching objectivesto school priorities | Provide goal alignment coaching and workshops | Trainingon strategic priority awareness Individual goal-settingand alignment exercises Reviewand feedback sessions | Teachers, Supervisors | March 2028 | Trainer fees: 8,000 Materials and guides: 4,000 Refreshments and logistics: 3,000 | 85% individual goals consistent with school priorities | |
| Ensure classroom strategies support school learning improvement | Facilitate workshops and coaching on strategy alignment | Workshops on learning improvement plans. Collaborative strategy sessions Monitoring classroom implementation | Teachers, Supervisors | March 2028 | Facilitator fees: 8,000 Materials and planning aids: 4,000 Logistics and refreshments: 3,000 | 85% classroom strategies alignedto school plans | |
| Improve teacher awareness of task significance to school goals | Conduct workshops and awareness campaigns | Awareness seminarson school objectives Mapping individual tasks to goals Interactive group discussions | Teachers, Supervisors, School Heads | February 2028 | Trainer fees: 8,000 Materials and activity guides: 4,000 Refreshments and logistics: 3,000 | 90% understand task-goal linkage | |
| Increase active participation in goal clarification meetings | Organize regular inclusive meetings | Schedule recurring meetings Facilitate goal clarification discussions | Teachers, Supervisors, School Heads | February 2028 | Facilitator fees: 6,000 Meeting materials: 3,000 Logistics and | 90% participate in goal clarification |
| Collect participation feedback | refreshments: 3,000 | ||||||
| Enhance staff knowledgeof theschool’s foundational statements | Provide orientation and regular refresher sessions | Orientation on vision, mission, objectives. Display and communication of statements Periodic knowledge checks | All staff | January 2028 | Facilitator fees: 8,000 Materials and displays: 4,000 Refreshments and logistics: 3,000 | 90% aware of school vision and mission | |
| Develop communication skillsfor promoting school vision | Conduct training on communicati onand advocacy | Trainingon effective communication Practiceand role-play sessions Monitor communication effectiveness | Teachers, Supervisors | January 2028 | Facilitator fees: 8,000 Materials and aides: 4,000 Refreshments and logistics: 3,000 | 90% effectively communicate sch |
| Key Result Areas | Objective | Strategy | Activities | Person Involved | Time Frame | Budget | Performanc e Indicators |
| C. LEVEL OF TEACHERS’ FULFILLMENT | |||||||
| 1. Instructiona lDelivery and Classroom Manageme nt | Increase adoptionof innovative and engaging teaching methods | Conduct capacity-building workshops on innovative instructional techniques | Workshop on new teaching strategies and technology integration Demonstration lessonsand peer teaching | Teachers, Supervisors | June 2028 | Facilitator fees: 6,000 Materials and digital aids: 3,000 Refreshments and logistics: 3,000 | 85% implement innovative teaching methods |
| Reflection and adaptation sessions | |||||||
| Enhance | Provide | Seminaron | Teachers, | May 2028 | Trainer fees: | 85%apply | |
| classroom | trainingon | establishing | Supervisors | 8,000 | effective | ||
| behavior | behavior | classroom | classroom | ||||
| management | management | rulesand | Materials and | management | |||
| skills | andpositive discipline | consequences | manuals: 4,000 | ||||
| Role-play scenarios for behavior management | Logistics and refreshments: 3,000 | ||||||
| Coaching and | |||||||
| feedbackon |
| classroom management | |||||||
| Improve clarity and organization in lesson delivery | Conduct workshops focusedon lesson planning and presentation | Trainingon structuring lessons effectively Peer review of lessonplans and presentations. Incorporate feedback into practice | Teachers, Supervisors | May 2028 | Facilitator fees: 6,000 Materials and lesson plan templates: 3,000 Refreshments and logistics: 3,00 | 85% demonstrate clearand organized lessons | |
| Foster positive classroom climateand student engagement | Conduct capacity-buildingon classroom environment and motivation | Workshop on creating positive classroom culture | Teachers, Supervisors | April 2028 | Facilitator fees: 8,000 Materials and engagement tools: 4,000 | 85% maintain positive classroom environments | |
| Activitiesfor student engagement strategies | Logistics and refreshments: 3,000 | ||||||
| Monitoring and support visits | |||||||
| Promote differentiated instruction approaches | Train teachers onvaried instructional strategies | Workshop on differentiated teaching methods. Lesson planning incorporating learner diversity | Teachers, Supervisors | April 2028 | Trainer fees: 8,000 Materials and planning guides: 4,000 Refreshments and logistics: 3,000 | 85%use diverse teaching strategies | |
| Peer exchange ofbest practices | |||||||
| Enhance responsivenes s and support forlearner needs | Provide trainingon formative assessment and responsive teaching | Workshop on identifying and addressing learner difficulties Role-playon questioning techniques | Teachers, Supervisors | March 2028 | Trainer fees: 6,000 Materials and assessment tools: 3,000 Logistics and refreshments: 3,000 | 85% effectively respondto student needs | |
| Coachingon responsive instruction | |||||||
| Strengthen implementatio n of consistent classroom | Conduct seminars on routine management | Trainingon establishing classroom procedures | Teachers, Supervisors | March 2028 | Facilitator fees: 6,000 Materials and | 85% maintain consistent routines |
| routines | and expectations | Observation and feedback onroutine management Continuous supportand coaching | routine guides: 3,000 Logistics and refreshments: 3,000 | ||||
| Improve pacing and timeliness inlesson delivery | Provide planning and time management workshops | Trainingon curriculum pacingand scheduling Planning and tracking lesson delivery Regular review and adjustment meetings | Teachers, Supervisors | February 2028 | Trainer fees: 8,000 Materials and pacing guides: 4,000 Refreshments and logistics: 3,000 | 90%deliver lessonson schedule | |
| Strengthen use of student data toinform instruction | Conduct trainingon formative assessment and data use | Workshop on monitoring student progress Using data to adjust instruction Peer collaboration and coaching | Teachers, Supervisors | February 2028 | Facilitator fees: 8,000 Materials and data tools: 4,000 Logistics and refreshments: 3,000 | 90%adjust teaching basedon progress | |
| Increase effective use of instructional materialsin teaching | Provide trainingon resource utilization and material development | Workshop on instructional materials selection and creation Hands-on sessions with teaching aids Sharingand evaluation of material use | Teachers, Supervisors | January 2028 | Facilitator fees: 8,000 Materials and aids: 4,000 Refreshments and logistics: 3,000 | 90% effectively utilize instructional materials | |
| 2. Community and Stakeholder Involvemen t | Enhance participation in community outreach and extension programs | Conduct trainingand planningfor community serviceand extension | Workshop on planning outreach projects Organize community extension activities. Evaluate participation and impact | Teachers, Supervisors, Community Leaders | June 2028 | Facilitator fees: 6,000 Materials and outreach supplies: 3,000 Logistics and refreshments: 3,000 | 80% participate activelyin outreach projects |
| Utilize community assetsto enrich classroom instruction | Facilitate workshops on community resource integration | Trainingon identifying community resources Develop lesson plansusing local resources. Sharebest practices and feedback | Teachers, Supervisors, Community Partners | May 2028 | Facilitator fees: 6,000 Materials and lesson aids: 3,000 Logistics and refreshments: 3,000 | 85% integrate community resources in lessons | |
| Strengthen collaboration with external educational partners | Organize partnership development and networking sessions | Workshops on partnership building Facilitate networking events Establish MOUsand collaboration plans | School Heads, Supervisors, Community Leaders | April 2028 | Facilitator fees: 8,000 Materials and event costs: 4,000 Refreshments and logistics: 3,000 | 85% build strong external partnerships | |
| Promote active advocacy for student welfare | Conduct trainingon community advocacy and engagement | Workshops on advocacy skills Plan advocacy initiatives Collaborate with stakeholders forstudent welfare | Teachers, Supervisors, Community Members | April 2028 | Facilitator fees: 6,000 Materials and advocacy tools: 3,000 Logistics and refreshments: 3,000 | 85% participate in student advocacy | |
| Improve communication channels with parentsand stakeholders | Provide trainingand establish communicatio n protocols | Workshop on effective communication strategies Develop communication plans. Evaluate communication effectiveness | Teachers, Supervisors, Parents | March 2028 | Facilitator fees: 8,000 Materials and communicatio n tools: 4,000 Logistics and refreshments: 3,000 | 85% maintain effective stakeholder communicatio n | |
| Foster student engagement in community activities | Organize student-community involvement programs | Organize awareness sessionsfor students. Facilitate student participation in initiatives | Teachers, Supervisors, Students | March 2028 | Facilitator fees: 6,000 Materials and activity supplies: 3,000 Logistics and refreshments: 3,000 | 85% students participate actively |
| Monitorand recognize student involvement | |||||||
| Strengthen programs enhancing ties between schooland community | Develop and implement community relation programs | Organize school-community events Partnerwith community organizations Assess program outcome | School Heads, Supervisors, Community Leaders | February 2028 | Facilitator fees: 8,000 Event materials and supplies: 4,000 Logistics and refreshments: 3,000 | 90% support school-community programs | |
| Enhance parent-school collaboration forstudent success | Provide trainingon parent engagement and collaboration | Workshops for effective parent collaboration. Organize parent involvement activities Collect feedback and improve processes | Teachers, Supervisors, Parents | February 2028 | Facilitator fees: 8,000 Materials and communicatio ns: 4,000 Logistics and refreshments: 3,000 | 90% parents actively collaborate | |
| Expand local stakeholder involvement in education programs | Facilitate stakeholder engagement initiatives | Conduct stakeholder mapping and engagement Organize joint programs Monitor stakeholder contributions | School Heads, Supervisors, Community Partners | January 2028 | Facilitator fees: 8,000 Materials and event costs: 4,000 Logistics and refreshments: 3,000 | 90% stakeholders involved | |
| Promote active school personnel participation in community programs | Organize and encourage community program involvement | Schedule community involvement opportunities Recognize participation efforts Monitor engagement levels | Teachers, Supervisors, Community Leaders | January 2028 | Facilitator fees: 8,000 Materials and recognition: 4,000 Logistics and refreshments: 3,000 | 95% participate in community programs | |
| 3. Learner Engageme ntand Achieveme nt | Enhance students’ critical thinking and problem-solving skills | Conduct trainingon instructional strategies promoting critical thinking | Workshop on critical thinking and problem-solving methods. | Teachers, Supervisors | June 2028 | Facilitator fees: 6,000 Materials and activity guides: 3,000 | 85% implement critical thinking activities effectively |
| Design problem-solving activities Classroom implementation andpeer sharing | Refreshments and logistics: 3,000 | ||||||
| Increase student motivation and active participation | Provide trainingon motivation techniques and engagement strategies | Workshop on student motivation strategies Develop interactive lesson plans Monitorand evaluate student participation | Teachers, Supervisors | May 2028 | Facilitator fees: 8,000 Materials and interactive aids: 4,000 Logistics and refreshments: 3,000 | 85% increase active student participation | |
| Promote use of interactive learning activities | Train teachers on interactive teaching methods and tools | Workshop on interactive activities Developand sharedigital and non-digital interactive tools Classroom trialsand feedback | Teachers, Supervisors | May 2028 | Trainer fees: 8,000 Materials and digital tools: 4,000 Refreshments and logistics: 3,000 | 85%use interactive activities regularly | |
| Foster student autonomy and responsibility in learning | Provide trainingon strategies for promoting independent learning | Workshop on self-directed learning techniques Develop studentself-monitoring tools Implement and review progress | Teachers, Supervisors | April 2028 | Facilitator fees: 6,000 Materials and monitoring tools: 3,000 Logistics and refreshments: 3,000 | 85% encourage independent learning | |
| Improve adaptive teaching methods based on student needs | Conduct workshops on differentiated and responsive instruction | Trainingon adjusting teaching approaches. Lessonplan adaptations Peer observations and feedback | Teachers, Supervisors | April 2028 | Facilitator fees: 6,000 Materials and lesson plan resources: 3,000 Logistics and refreshments: 3,000 | 85% effectively adjust teaching |
| Enhance relevance of lessons by linking to real-life contexts | Facilitate trainingand resource development for contextualized teaching | Workshop on real-life application strategies. Develop context-based lesson examples Implement and share results | Teachers, Supervisors | March 2028 | Facilitator fees: 6,000 Materials and examples: 3,000 Logistics and refreshments: 3,000 | 85% connect lessonsto real-life examples | |
| Encourage cooperative learning and peer engagement | Conduct trainingon collaborative learning strategies | Workshop on group work facilitation and dynamics Activities for peer learning. Monitor group interactions and outcome | Teachers, Supervisors | March 2028 | Facilitator fees: 6,000 Materials for group activities: 3,000 Logistics and refreshments: 3,000 | 85% promote effective peer collaboration | |
| Establish practices for acknowledging student success | Organize trainingand systemsfor recognition | Workshops on recognition strategies Develop award and celebration plans Implement recognition events | Teachers, Supervisors, School Heads | February 2028 | Facilitator fees: 6,000 Materials and awards: 3,000 Logistics and refreshments: 3,000 | 90% regularly recognize student achievements | |
| Strengthen formative assessment and remedial support | Provide advanced trainingon assessment and intervention | Workshop on progress monitoring techniques Establish support plans for struggling learners Provide coaching and follow-up monitoring | Teachers, Supervisors | February 2028 | Facilitator fees: 8,000 Materials and assessment tools: 4,000 Logistics and refreshments: 3,000 | 90% effectively support struggling students | |
| Improve use of feedback to drive learning improvements | Facilitate formative feedback training | Workshop on feedback principles and techniques Practice providing constructive feedback | Teachers, Supervisors | February 2028 | Facilitator fees: 8,000 Materials and feedback forms: 4,000 Logistics and refreshments: 3,000 | 90%utilize formative feedback effectively |
| Monitor impact on student outcomes | |||||||
| 4. Assessmen tand Feedback Practices | Develop students’ capacityfor self-assessment and reflection | Provide trainingon self-assessment techniques and reflective practices | Workshop on studentself-assessment methods. Develop self-assessment tools. Implement reflective activitiesin class | Teachers, Supervisors | June 2028 | Facilitator fees: 6,000 Materials and tools: 3,000 Refreshments and logistics: 3,000 | 85% implement self-assessment activities |
| Enhance the use of varied and authentic assessment methods | Train teachers ondiverse assessment strategies | Workshop on tests, projects, portfolios Develop varied assessment tasks Peer sharing of assessment practices | Teachers, Supervisors | May 2028 | Facilitator fees: 8,000 Materials and templates: 4,000 Logistics and refreshments: 3,000 | 85%apply varied assessment methods | |
| Improve assessment alignment with curriculum standards | Conduct workshops on designing aligned assessments | Trainingon assessment blueprinting. Reviewand revise assessment tools. Monitor alignmentin practice | Teachers, Supervisors | May 2028 | Facilitator fees: 8,000 Materials and alignment guides: 4,000 Logistics and refreshments: 3,000 | 85% assessments alignedwith objectives | |
| Enhance timely and effective feedback practices | Provide trainingon feedback methods | Workshop on timely, constructive feedback Develop feedback protocols Monitor feedback implementation | Teachers, Supervisors | April 2028 | Facilitator fees: 6,000 Materials and templates: 3,000 Logistics and refreshments: 3,000 | 85% provide timelyand constructive feedback | |
| Promote use of technology in assessment and feedback | Conduct trainingon digital assessment tools | Workshop on tech tools for assessment Hands-on sessions with | Teachers, Supervisors, ICT Coordinators | April 2028 | Facilitator fees: 8,000 Materials and software access: 4,000 Logistics and | 85%use technology in assessment |
| software/platfor ms Sharingof tech-enabled assessment practices | refreshments: 3,000 | ||||||
| Improve fairnessand consistency in grading | Train teachers on grading standards and rubrics | Workshop on grading fairnessand objectivity Develop and use grading rubrics Moderation and calibration sessions | Teachers, Supervisors | March 2028 | Facilitator fees: 6,000 Materials and rubric templates: 3,000 Logistics and refreshments: 3,000 | 90% apply fair grading practices | |
| Enhance use of data from assessments for instructional decisions | Conduct trainingon data-driven instruction | Workshop on analyzing assessment data Instructional planning based on results Monitor instructional adjustments | Teachers, Supervisors | March 2028 | Facilitator fees: 8,000 Materials and data tools: 4,000 Logistics and refreshments: 3,000 | 90%use assessments toguide teaching | |
| Improve communication ofstudent progressto stakeholders | Provide trainingon communicatio nstrategies and reporting | Workshop on reporting assessment results Develop report templates. Conduct parent-teacher communication sessions | Teachers, Supervisors, Parents | March 2028 | Facilitator fees: 6,000 Materials and templates: 3,000 Logistics and refreshments: 3,000 | 90% communicate results effectively | |
| Strengthen diagnostic use of assessments | Provide advanced trainingon assessment interpretation | Workshop on diagnosing learning gaps Develop targeted interventions Monitor impact of interventions | Teachers, Supervisors | February 2028 | Facilitator fees: 8,000 Materials and diagnostic tools: 4,000 Logistics and refreshments: 3,000 | 90% identify and address learning gaps | |
| Improve long-term monitoring of learner progress | Conduct trainingon progress tracking and continuous assessment | Workshop on longitudinal tracking methods | Teachers, Supervisors | February 2028 | Facilitator fees: 8,000 Materials and tracking tools: 4,000 | 90%track student progress consistently |
| Develop tracking tools and charts Regular data review meetings | Logistics and refreshments: 3,00 | ||||||
| 5. Professiona lGrowth and Accountabil ity | Foster proactive problem-solvingand initiative-taking among teachers | Conduct trainingon leadership and problem-solving skills | Workshop on proactive teaching and leadership Case studies of problem-solving Actionplan development and monitoring | Teachers, Supervisors | June 2028 | Facilitator fees: 6,000 Materials and case studies: 3,000 Logistics and refreshments: 3,000 | 85%take initiativeto address challenges |
| Strengthen accountability practices relatedto student performance | Provide trainingon outcome-based accountability | Workshop on accountability principles Develop measurement and reporting tools Regular monitoring and feedback | Teachers, Supervisors, School Heads | May 2028 | Facilitator fees: 8,000 Materials and reporting templates: 4,000 Logistics and refreshments: 3,000 | 90% maintain accountability forlearning outcomes | |
| Encourage regular reflective teaching practices | Facilitate trainingon reflection and self-assessment | Workshop on reflective teaching strategies Develop reflection journalsor portfolios Peer sharing and feedback sessions | Teachers, Supervisors | May 2028 | Facilitator fees: 6,000 Materials and reflection templates: 3,000 Logistics and refreshments: 3,000 | 85% engage in reflective practices | |
| Improve accuracy and organization in instructional record-keeping | Conduct trainingon record management anddigital tools | Workshop on effective record-keeping Trainingon digital record systems Regular audits and coaching | Teachers, Supervisors | April 2028 | Facilitator fees: 6,000 Materials and digital tools: 3,000 Logistics and refreshments: 3,000 | 90% maintain organized instructional records | |
| Increase teacher participation in school improvement | Organize trainings and information sessions | Workshop on the importance ofschool improvement. | Teachers, Supervisors, School Heads | April 2028 | Facilitator fees: 8,000 Materials and planning tools: | 85% actively participate in initiatives |
| activities | Facilitate involvement in initiatives Monitor engagement and contributions | 4,000 Logistics and refreshments: 3,000- | |||||
| Promote ethical conduct and responsibility in teaching profession | Provide ethics and professionalis m training | Workshop on professional ethics Casestudy discussions Developand disseminate codeof conduct | Teachers, Supervisors | April 2028 | Facilitator fees: 6,000 Materials and case studies: 3,000 Logistics and refreshments: 3,000 | 90% demonstrate ethical behavior | |
| Strengthen commitment and reliability in teaching tasks | Provide motivational trainingand suppor | Workshop on professional responsibility Goal-setting exercises Monitoring and recognition | Teachers, Supervisors | March 2028 | Facilitator fees: 6,000 Materials and motivational aids: 3,000 Logistics and refreshments: 3,000 | 85% commit fullyto teaching duties | |
| Increase teacher participation in professional growth opportunities | Organize and promotePD workshops and seminars | Identifyand schedule PD activities Facilitate trainings and workshops Track participation and impact | Teachers, Supervisors | February 2028 | Facilitator fees: 8,000 Materials and venue rent: 4,000 Logistics and refreshments: 3,0009 | 90% actively participate in PD | |
| Encourage feedback-seekingto enhance practice | Conduct trainingon givingand receiving feedback | Workshop on feedback skills Establish feedback culture Feedback sessions and follow-up | Teachers, Supervisors | February 2028 | Facilitator fees: 6,000 Materials and feedback tools: 3,000 Logistics and refreshments: 3,000 | 90% regularly seek feedback | |
| Foster opennessto continuous learningand innovation | Provide trainingon adoption of new teaching practices | Workshop on innovative pedagogy Demonstrate new strategies | Teachers, Supervisors | January 2028 | Facilitator fees: 8,000 Materials and innovative tools: 4,000 Logistics and refreshments: | 95% demonstrate willingness to innovate |
| Encourage peer collaboration and sharing | 3,00 |
| Key Result Areas | Objective | Strategy | Activities | Person Involved | Time Frame | Budget | Performanc e Indicators |
| D. CHALLENGES ENCOUNTERED | |||||||
| 1. Relative to Digital Aptitude | Improve internet access reliability and speed | Coordinate with providers and upgrade school infrastructure | Assess current internet service quality Partner with providers for upgrades | School Heads, LGUs, Internet Service Providers | January 2028 | Infrastructure upgrades: 45,000 Backup system setup: 5,000 | 90% reliable internet connectivity |
| Install backup connectivity option | |||||||
| Increase accessto adequate digital devices | Facilitate device acquisition and distribution | Conduct needs assessment. | School Heads, Local Government Units, PTAs | February 2028 | Device procurement: 45,000 | 85%have accessto necessary devices | |
| Seek funding or partnerships fordevice procurement | Distribution logistics: 5,000 | ||||||
| Manage equitable device distribution | |||||||
| Improve training coverage on digital tools | Conduct comprehensive training programs | Schedule regular training sessions. Develop orientation materials. Provide follow-up technical assistance | Teachers, ICTStaff, Supervisors | February 2028 | Facilitator fees: 8,000 Materials and orientation kits: 4,000 Logistics and refreshments: 3,000 | 85% complete training on digital tools | |
| Enhance | Develop | Train | ICTStaff, | March 2028 | Trainer fees: | 90%report | |
| technical | technical | designated IT | School | 6,000 | satisfactory | ||
| support | support teams | support | Heads, | technical | |||
| availability and quality | and systems | personnel | Supervisors | Materials and system setup: | support | ||
| Establish | 3,000 | ||||||
| helpdesk and ticketing system. | Logistics and refreshments: 3,000 |
| Regular reviewand capacity-building sessions | |||||||
| Strengthen management ofonline learning environments | Provide training ononline classroom management | Workshop on managing virtual classrooms = Strategies to increase student participation | Teachers, Supervisors, ICT Coordinators | March 2028 | Trainer fees: 8,000 Materials and monitoring tools: 4,000 Logistics and refreshments: 3,000 | 85% manage online classes effectively | |
| Use of digital toolsfor monitoring | |||||||
| Enhance teachers’ skills in technology integration for instruction | Provide training and coaching ontech integration | Workshops on lesson planning with technology Demonstratio ns of tech-enhanced lessons | Teachers, Supervisors, ICT Coordinators | May 2028 | Facilitator fees: 8,000 Materials and tech aids: 4,000 Logistics and refreshments: 3,00 | 85% effectively integrate technology in lessons | |
| Peer observations and feedback | |||||||
| Increase awareness and prevention of cybersecurity risks | Conduct cybersecurity awareness and prevention training | Workshop on cybersecurity threatsand safe practices Develop cybersecurity guidelines. Conduct simulated phishing exercises | Teachers, Staff,ICT Security | April 2028 | Facilitator fees: 6,000 Materials and guidelines: 3,000 Logistics and refreshments: 3,00 | 90% demonstrate cybersecurity awareness | |
| Improve availability and utilizationof digital educational resources | Facilitate resource sourcingand capacity building | Surveyand identify needed digital resources. Build awareness on available software Trainingon effective | School Heads, Teachers, ICT Staff | April 2028 | Facilitator fees: 6,000 Materials and resource guidelines: 3,000 Logistics and refreshments: 3,00 | 85%utilize adequate digital resources |
| resource utilization | |||||||
| Raise digital literacy levels across all school | Implement basicto intermediate digital literacy programs | Conduct digital literacy training sessions. Develop user-friendly digital literacy resources | Teachers, Students, Non-Teaching Staff | May 2028 | Trainer fees: 8,000 Materials and assessment tools: 4,000 Logistics and refreshments: 3,000 | 85% improve digital literacy | |
| Conduct literacy assessments and follow-ups | |||||||
| Improve adaptability and familiarity with emerging technologies | Provide ongoing trainingand update orientation sessions | Regular workshops on newdigital platforms and their features. | Teachers, ICTStaff, Supervisors | June 2028 | Facilitator fees: 6,000 Training materials and tutorials: 3,000 | 85%adapt effectively to new technologies | |
| Develop step-by-step guides/tutorial s | Refreshments and logistics: 3,000 | ||||||
| Continuous supportvia helpdeskor peer mentoring | |||||||
| 2. Relative to Professional Collaboratio nand Administrati ve Support | Increase resources and supportfor collaborative programs | Seek funding andoptimize resource allocationfor collaborative efforts | Identify resource needsand gaps Coordinate with stakeholders for funding | School Heads, Supervisors, PTA | January 2028 | Funding for program materials: 35,000 Logistics and support: 5,000 | 90% receive adequate resources for collaboration |
| Monitor and report resource utilization | |||||||
| Expand opportunities for collaborative planning and teamwork | Organize regular collaborative sessions and team-building activities | Schedule consistent planning meetings. Conduct teamwork workshops Encourage cross- | Teachers, Supervisors, School Heads | February 2028 | Facilitator fees: 8,000 Materials and workshops: 4,000 Logistics and refreshments: 3,000 | 85% actively participate in collaborative planning |
| department collaboration | |||||||
| Helpstaff | Providetime | Workshop on | Teachers, | March 2028 | Trainer fees: | 85%report | |
| effectively | management | effective | Supervisors | 6,000 | improved work | ||
| manage | and workload | workload | balance | ||||
| administrative | balancing | management. | Materials and | ||||
| and teaching roles | training | Develop tools fortracking | tracking templates: 3,000 | ||||
| duties. | Logistics and | ||||||
| Coaching and peer support | refreshments: 3,000 | ||||||
| Strengthen support systems from administrators | Conduct leadership trainingand communication enhancement sessions | Leadership workshops for supervisors. Establish support feedback loops Monitor guidance effectiveness | School Heads, Supervisors | April 2028 | Facilitator fees: 8,000 Materials and communicatio n tools: 4,000 Logistics and refreshments: 3,000 | 85% receive adequate administrative support | |
| Improve decision-making efficiency and transparency | Streamline decision-making processes with clear protocols | Develop decision-making guidelines Train staff on protocols | School Heads, Supervisors | April 2028 | Facilitator fees: 6,000 Materials and guideline documents: 3,000 | 90%report timely decision-making | |
| Monitor decision- making timelines | Logistics and refreshments: 3,000 | ||||||
| Promote openness to changeand innovation | Conduct change management and motivation workshops | Workshop on benefits of innovation Share success stories Encourage pilot programs | Teachers, Supervisors | May 2028 | Facilitator fees: 6,000 Materials and case studies: 3,000 Refreshments and logistics: 3,000 | 85%show improved openness to change | |
| Establish effective and clear communicatio n channel | Develop communication protocols and train personnel | Create communicatio n flowcharts. Conduct communicatio nskills trainings Monitor communicatio | All Staff | May 2028 | Facilitator fees: 6,000 Materials and communicatio n tools: 3,000 Logistics and refreshments: 3,000 | 85%report clear communicatio n |
| n effectiveness | |||||||
| Align school visionand goals among all stakeholders | Facilitate vision andgoal alignment workshops | Organize vision clarification sessions. Develop shared goal statements Regular reviewand alignment meeting | School Heads, Supervisors, Teachers | June 2028 | Facilitator fees: 8,000 Materials and handouts: 4,000 Logistics and refreshments: 3,000 | 85% aligned withschool visionand goals | |
| Enhance recognition and motivation systemsfor teachers | Developand implementa recognition program | Establish criteriafor recognition. Organize award ceremonies. Communicate achievements school-wid | School Heads, Supervisors | June 2028 | Facilitator fees: 6,000 Awards and certificates: 4,000 Event logistics: 2,000 | 90%feel recognized and motivated |
-
SUMMARY OF BUDGET ESTIMATES
| Key Area | Estimated Budget (PHP) |
| Digital Aptitudes | 193,000+ |
| Professional Collaboration & Administrative Support | 81,000+ |
| Teachers’ Fulfillment | 69,000+ |
| Total Estimated Budget | 343,000+ |
-
PROGRAM MONITORING AND EVALUATION
| Monitoring Activity | Description | Schedule | Responsible Persons |
| Attendance Monitoring | Track participants per session | Per activity | Program Coordinator |
| Skills Assessments | Pre/post knowledge or skills testing | Quarterly | Supervisors, Trainers |
| Participant Feedback | Collect feedback and satisfaction | After sessions | Program Admin |
| Progress Review | Assess achievement of performance indicators | Semi-annually | School Heads, Supervisors |
-
CERTIFICATION AND RECOGNITION
All participants completing sessions will receive DepEd-compliant certificates. Outstanding
performers will be acknowledged during school award ceremonies to foster morale and motivation.
Prepared by:
NESTOR A. MADI JR.
Date:
APPENDIX B LETTER OF PERMISSION
APPENDIX C SURVEY QUESTIONNAIRE
DIGITAL APTITUDES, PROFESSIONAL COLLABORATION AND ADMINISTRATIVE SUPPORT, AND TEACHERS’ FULFILLMENT IN PUBLIC ELEMENTARY SCHOOLS IN THE DIVISION OF PASIG CITY: BASIS FOR AN INTERVENTION PLAN
Part I: Profile of the Respondents
Name: (Optional)_ _ _ _ _ _ _ _ _ _ _ _ _ _ _ _ _ _ _ School:
Direction: Please put a check (√) mark on the space provided that corresponds to your answer.
Type of Respondents:
Supervisor
School Head
Teacher
Non-teaching Personnel
AGE
51 years old and above
46 – 50 years old
41 – 45 years old
36 – 40 years old
31 – 35 years old
26 – 30 years old
25 years old and below
Sex
Male
Female
Civil Status
Single
Married
Widow/er
Legally Separated
Highest Educational Attainment
Doctorate Degree
W/Doctorate Units
Master Degree
W/Master Units
Bachelor Degree
Number of Years in Service
31 years and above
26 – 30 years
21 – 25 years
16 – 20 years
11 – 15 years
6 – 10 years
5 years old and below
Part II: Assessment on Digital Aptitudes in Public Elementary Schools in the Division of Pasig City
Directions: Kindly indicate whether the statement determines the area by putting a check (/) mark in the appropriate column using the legend below:
| Scale | Range | Verbal Interpretation | Symbol |
| 5 | 4.20 – 5.00 | Highly Evident | HE |
| 4 | 3.40 – 4.19 | Evident | E |
| 3 | 2.60 – 3.39 | Moderately Evident | ME |
| 2 | 1.80 – 2.59 | Least Evident | LE |
| 1 | 1.00 - 1.79 | No Evident | NE |
| A. Digital Literacy | 5 | 4 | 3 | 2 | 1 | |
| Indicators | ||||||
| 1. | Abilitytoefficientlyoperate computers, tablets, and other digital devices in classroom and office tasks. |
| 2. | Proficiencyin usingproductivity software(e.g.,MSOffice,Google Workspace) for lesson preparation and reporting. | |||||
| 3. | Skill in performing advanced internet searchesforcurriculum-related resources. | |||||
| 4. | Capability to evaluate online sources for credibility and relevance in teaching materials. | |||||
| 5. | Understanding of fundamental digital concepts such as cloud storage, cybersecurity, and software updates. | |||||
| 6. | Ability to troubleshoot minor technical issues in hardware and software. | |||||
| 7. | Skill in managing email, online calendars, and school communication platforms for administrative tasks. | |||||
| 8. | Ability to organize, label, and store digital files and learning resources systematically. | |||||
| 9. | Capabilitytofollowdigital instructions from manuals, tutorials, or online guides independently. | |||||
| 10. | Commitment to upgrading digital knowledge and skills through training or self-learning. | |||||
| B. Instructional Technology Integration | ||||||
| Indicators | ||||||
| 1. | Consistent use of multimedia presentations (PowerPoint, Prezi, or Canva) in teaching lessons. | |||||
| 2. | Integration of interactive tools (Kahoot! Quizizz, Padlet) to enhance student engagement. | |||||
| 3. | Use of digital simulations, videos, and animations to illustrate abstract concepts. |
| 4. | Alignmentoftechnology-enhanced activitieswithDepEdcurriculum standards. | |||||
| 5. | Abilitytousetechnologyto differentiate instruction according to learners’ abilities. | |||||
| 6. | Selection of the most appropriate digital tools for specific learning objectives. | |||||
| 7. | Ability to create collaborative online learningexperiencesusingshared platforms. | |||||
| 8. | Use of technology to assess student learning outcomes efficiently. | |||||
| 9. | Confidence in experimenting with emerging educational technologies in instruction. | |||||
| 10. | Consistent evaluation of the effectiveness of technology integration on student learning. | |||||
| C.Online Classroom Management | ||||||
| Indicators | ||||||
| 1. | Establishment of clear rules, routines, and expectations for online classes. | |||||
| 2. | Establishment of clear rules, routines, and expectations for online classes. | |||||
| 3. | Use of interactive polls, chat, and breakout rooms to maintain student engagement. | |||||
| 4. | Ability to address student misbehavior or distractions during virtual lessons. | |||||
| 5. | Use of online tools to track progress, participation, and submission of tasks. | |||||
| 6. | Clear communication of learning objectives, instructions, and deadlines online. | |||||
| 7. | Ability to create a supportive and inclusive online learning environment. | |||||
| 8. | Timely feedback and follow-up with |
| students during online sessions. | ||||||
| 9. | Effectivetimemanagementduring synchronous and asynchronous classes. | |||||
| 10. | Use of platform features (mute/unmute, screen share, etc.) to maintain focus and order. | |||||
| D.Content Creation and Curation | ||||||
| Indicators | ||||||
| 1. | Creation of original lesson materials, suchasinteractivepresentations, videos, and worksheets. | |||||
| 2. | Customization of content to meet the diverse learning needs of students. | |||||
| 3. | Systematic organization of digital teaching resources for easy access and reuse. | |||||
| 4. | Curation of age-appropriate and relevant online materials aligned with the DepEd curriculum. | |||||
| 5. | Incorporation of multimedia elements (images, audio, video) to enhance 6. learning experiences. | |||||
| 6. | Adaptation of resources to various grade levels and learning competencies. | |||||
| 7. | Useofcopyright-freeorlicensed materials appropriately. | |||||
| 8. | Regularupdatingofinstructional content to reflect current knowledge and digital trends. | |||||
| 9. | Creative use of gamified elements to make lessons more engaging. | |||||
| 10. | Evaluation of content quality, accuracy, and alignment with learning objectives. | |||||
| E. Cybersecurity Awareness | ||||||
| Indicators | ||||||
| 1. | Awareness of common cybersecurity threats such as phishing, malware, and ransomware. |
| 2. | Implementation of strong passwords and secureauthenticationmethodsfor accounts. | |||||
| 3. | Knowledge of how to identify suspicious emails and links. | |||||
| 4. | Proper handling of sensitive student information and administrative records. | |||||
| 5. | Awareness of the DepEd ICT security policies and guidelines. | |||||
| 6. | Safe use of school-issued and personal devices in professional contexts. | |||||
| 7. | Updating software and systems to ensure protection from vulnerabilities. | |||||
| 8. | Responsible sharing of files, documents, and online resources. | |||||
| 9. | Reporting cyber threats or incidents according to school protocols. | |||||
| 10. | Promotion of cyber safety awareness among students. | |||||
| F. Digital Communication Skills | ||||||
| Indicators | ||||||
| 1. | Clarity and conciseness in written digital communication with students, parents, and colleagues. | |||||
| 2. | Professional use of email, chat, and messaging platforms in school-related tasks. | |||||
| 3. | Ability to convey instructions and learningexpectationsonline effectively. | |||||
| 4. | Responsiveness to digital communications within an appropriate timeframe. | |||||
| 5. | Maintaining proper digital etiquette and respectful tone in all communications | |||||
| 6. | Ability to collaborate and coordinate digitally with fellow educators and staff. | |||||
| 7. | Ability to collaborate and coordinate |
| digitally with fellow educators and staff. | ||||||
| 8. | Efficient use of communication tools for school announcements and reminders. | |||||
| 9. | Ability to resolve issues and clarify misunderstandings digitally. | |||||
| 10. | Documentation and archiving of important communications for accountability. | |||||
| G.Use of Educational Platforms | ||||||
| Indicators | ||||||
| 1. | Familiarity with learning management systems like DepEd Commons, Google Classroom, or Moodle. | |||||
| 2. | Ability to navigate and upload instructional materials and assignments on platforms. | |||||
| 3. | Use of platforms to assess learner performance and provide feedback. | |||||
| 4. | Tracking and monitoring student progress through analytics features. | |||||
| 5. | Use of interactive tools such as quizzes, discussion boards, and polls. | |||||
| 6. | Troubleshooting minor platform issues independently or collaboratively. | |||||
| 7. | Guidingstudentsinusingonline platforms effectively. | |||||
| 8. | Regular and consistent use of platforms to enhance learning outcomes. | |||||
| 9. | Collaboration with peers to improve platform utilization. | |||||
| 10. | Openness to adopt new platforms or digital tools introduced by the school or DepEd. | |||||
| H.Problem-Solving in Digital Contexts | ||||||
| Indicators | ||||||
| 1. | Identifyingtechnicalissuesduring lessons and finding immediate solutions. | |||||
| 2. | Usingonlineresourcestoaddress classroom and administrative digital |
| challenges. | ||||||
| 3. | Applying logical thinking to troubleshoot digital problems efficiently. | |||||
| 4. | Adjusting digital solutions to fit specific school or classroom situations. | |||||
| 5. | Collaborating with colleagues to solve technology-related issues. | |||||
| 6. | Utilizing digital resources to enhance problem-solving skills. | |||||
| 7. | Demonstrating persistence and patience in resolving technical difficulties. | |||||
| 8. | Learning from previous experiences to prevent recurring digital issues. | |||||
| 9. | Applyinginnovativeapproachesto overcome technology-related obstacles. | |||||
| 10. | Sharing problem-solving strategies with peers for collective improvement. | |||||
| I.Adaptability to Emerging Technologies | ||||||
| Indicators | ||||||
| 1. | Willingness to adopt new educational technologies introduced in schools. | |||||
| 2. | Ability to adjust teaching methods to new digital tools and platforms. | |||||
| 3. | Readiness to learn and implement new software or hardware for instruction. | |||||
| 4. | Confidenceinexploringunfamiliar technologies. | |||||
| 5. | Flexibility in integrating alternative digital resources into lessons. | |||||
| 6. | Continuousupdatingofprofessional digital skills. | |||||
| 7. | Positive attitude towards technology-driven teaching reforms. | |||||
| 8. | Openness to professional development opportunities in technology integration. | |||||
| 9. | Rapid adjustment to technology changes in both classroom and administrative work. |
| 10. | Encouraging students to embrace and utilize emerging technologies. | |||||
| J.Digital Ethics and Responsibility | ||||||
| Indicators | ||||||
| 1. | Following ethical guidelines for online behavior in school and personal contexts. | |||||
| 2. | Respecting intellectual property rights when using digital resources. | |||||
| 3. | Responsible use of social media and digital communication channels. | |||||
| 4. | Avoiding plagiarism in all digital instructional content. | |||||
| 5. | Teaching students’ responsible digital citizenship. | |||||
| 6. | Maintainingintegritywhenhandling online assessments. | |||||
| 7. | Awareness of legal consequences for unethical digital practices. | |||||
| 8. | Encouragingpeersandstudentsto practice ethical technology use. | |||||
| 9. | Ensuring all shared digital materials comply with copyright laws. | |||||
| 10. | Modeling responsible and ethical digital behavior consistently. | |||||
| K.Data Management Preservation | ||||||
| Indicators | ||||||
| 1. | Organizing digital records and resources systematically for easy retrieval. | |||||
| 2. | Securely storing sensitive student and school data. | |||||
| 3. | Conducting regular backups of essential digital files. | |||||
| 4. | Maintaining accurate records of student assessmentsandadministrative documents. | |||||
| 5. | Using digital tools to monitor and track data effectively.in actual classroom practice. | |||||
| 6. | Ensuring compliance with DepEd data |
| management guidelines. | ||||||
| 7. | Implementing version control for lesson plans and digital resources. | |||||
| 8. | Minimizing data loss risks through secure storage practices. | |||||
| 9. | Training or guiding others on proper data management procedures. | |||||
| 10. | Periodically reviewing data organization and updating systems as needed. | |||||
| L.Digital Survival Skills | ||||||
| Indicators | ||||||
| 1. | Functioningeffectivelyinonline teaching and administrative tasks. | |||||
| 2. | Managingworkloadefficientlyusing digital tools. | |||||
| 3. | Problem-solvinginreal-timeduring digital instruction. | |||||
| 4. | Learning new digital tools independently to meet job requirements. | |||||
| 5. | Coping with technological challenges without disrupting teaching. | |||||
| 6. | Managing time and tasks effectively using digital planners and tools. | |||||
| 7. | Remaining resilient under pressure from technological changes. | |||||
| 8. | Continuing to improve digital competence through professional development | |||||
| 9. | Maintainingperformanceduring technology failures or limitations. | |||||
| 10. | Preparing for future digital trends to ensure continued teaching effectiveness. |
Part III: Assessment of Professional Collaboration and Administrative Support
Directions: Kindly indicate whether the statement determines the area by putting a check (/) mark in the appropriate column using the legend below:
| Scale | Range | Verbal Interpretation | Symbol |
| 5 | 4.20 – 5.00 | Highly Evident | HE |
| 4 | 3.40 – 4.19 | Evident | E |
| 3 | 2.60 – 3.39 | Moderately Evident | ME |
| 2 | 1.80 – 2.59 | Least Evident | LE |
| 1 | 1.00 - 1.79 | Not Evident | NE |
| A. Shared Vision and Goal Alignment | 5 | 4 | 3 | 2 | 1 | |
| Indicators | ||||||
| 1. | Awareness of the school’s vision, mission, and core objectives. | |||||
| 2. | Consistency of personal teaching goals with the school’s strategic priorities. | |||||
| 3. | Understanding how individual tasks contribute to overall school objectives. | |||||
| 4. | Participationinmeetingsand discussions to clarify school goals. | |||||
| 5. | Alignment of classroom strategies with school-wide learning improvement plans. | |||||
| 6. | Ability to communicate the school’s vision to colleagues and students. | |||||
| 7. | Collaborationwithcolleaguesto achieve common school targets | |||||
| 8. | Engagement in planning initiatives that reinforce shared goals. | |||||
| 9. | Awareness of policy changes and adaptation to align with new school objectives. | |||||
| 10. | Contribution to monitoring and evaluating the progress of shared goals. | |||||
| B. Collaborative Planning and Teamwork | ||||||
| Indicators | ||||||
| 1. | Active participation in departmental or grade-level planning sessions. | |||||
| 2. | Sharing instructional materials and resources with colleagues. | |||||
| 3. | Coordinating schedules and lesson plans |
| to avoid overlaps. | ||||||
| 4. | Providingconstructivefeedbackto peers during collaborative tasks. | |||||
| 5. | Joint development of interdisciplinary or school-wide projects. | |||||
| 6. | Problem-solving collectively to address classroom or administrative challenges. | |||||
| 7. | Supportingcolleaguesduringhigh- demand periods or special projects. | |||||
| 8. | Communicating openly and effectively within teams. | |||||
| 9. | Respecting diverse perspectives and integrating them into planning. | |||||
| 10. | Engaging in peer mentoring or co-teaching activities. | |||||
| C. Instructional Leadership and Supervisory Support | ||||||
| Indicators | ||||||
| 1. | Receiving timely guidance and feedback from supervisors on instructional practices. | |||||
| 2. | Supervisorsmonitoringclassroom practices to identify strengths and areas for improvement. | |||||
| 3. | Encouragement from school heads to innovateandimplementeffective teaching strategies. | |||||
| 4. | Availability of mentorship or coaching for professional development. | |||||
| 5. | Assistance in aligning lesson plans with curriculum standards. | |||||
| 6. | Opportunities for professional growth through workshops, seminars, and training. | |||||
| 7. | Recognitionofaccomplishmentsand effective practices by school leaders | |||||
| 8. | Support in resolving classroom or student-related challenges. | |||||
| 9. | Clear communication of school policies |
| and expectations by supervisory staff. | ||||||
| 10. | Active involvement of school leaders in facilitating a positive teaching and learning environment. | |||||
| D. Communication and Decision-Making Support | ||||||
| Indicators | ||||||
| 1. | Clear dissemination of important school announcements and policies. | |||||
| 2. | Opportunitiestoparticipatein decision-making processes related to instruction or administration. | |||||
| 3. | Timely communication of changes in schedules, curriculum, or administrative requirements. | |||||
| 4. | Encouragement to express ideas and suggestions freely. | |||||
| 5. | Efficient use of meetings, memos, and digital platforms for school communication. | |||||
| 6. | Support from supervisors when making instructional or classroom decisions. | |||||
| 7. | Accessibility of school leaders for consultation on work-related issues. | |||||
| 8. | Clarityofroleexpectationsin decision-making processes. | |||||
| 9. | Transparency in the implementation of school policies and initiatives. | |||||
| 10. | Feedback mechanisms that allow teachers and staff to voice concerns or propose improvements. | |||||
| E. Recognition, Motivation and Well—being Support | ||||||
| Indicators | ||||||
| 1. | Regular acknowledgment of teacher and staff achievements. | |||||
| 2. | Provision of incentives or awards for exceptional performance. | |||||
| 3. | Emotional support and encouragement during challenging teaching periods. |
| 4. | Promotion of work-life balance among teaching and non-teaching personnel. | |||||
| 5. | Availability of programs to enhance teacherwell-being(e.g.,wellness seminars, counseling). | |||||
| 6. | Positive reinforcement for innovative and effective teaching practices. | |||||
| 7. | Recognition of contributions to collaborative and school-wide initiatives. | |||||
| 8. | Supportive work environment that fosters motivation and job satisfaction. | |||||
| 9. | Encouragement of professional growth through training and skill development. | |||||
| 10. | Implementation of policies and practices that reduce stress and enhance teacher morale. |
Part IV: Assessment on the Level of Teachers’ Fulfillment
Directions: Kindly indicate whether the statement determines the area by putting a check (/) mark in the appropriate column using the legend below:
| Scale | Range | Verbal Interpretation | Symbol |
| 5 | 4.20 – 5.00 | Highly Fulfilled | HF |
| 4 | 3.40 – 4.19 | Fulfilled | F |
| 3 | 2.60 – 3.39 | Moderately Fulfilled | MF |
| 2 | 1.80 – 2.59 | Least Fulfilled | LF |
| 1 | 1.00 - 1.79 | Not Fulfilled | NF |
| A. Instructional Delivery and Classroom Management Indicators | 5 | 4 | 3 | 2 | 1 | |
| Indicators | ||||||
| 1. | Clarity and organization of lesson presentations. |
| 2. | Ability to maintain a positive and conducive classroom environment. | |||||
| 3. | Effectiveness in managing classroom rules and student behavior. | |||||
| 4. | Use of diverse teaching strategies to meet different learner needs. | |||||
| 5. | Timely delivery of lessons according to the curriculum plan. | |||||
| 6. | Incorporationofinstructional materials and resources to enhance learning. | |||||
| 7. | Responsiveness to students’ questions and learning difficulties. | |||||
| 8. | Implementation of innovative teaching methods and activities. | |||||
| 9. | Monitoring and adjusting instruction based on student progress. | |||||
| 10. | Maintaining consistency in classroom routines and expectations. | |||||
| B. Learner Engagement and Achievement | ||||||
| Indicators | ||||||
| 1. | Abilitytomotivatestudentsto actively participate in lessons. | |||||
| 2. | Encouragement of critical thinking and problem-solving among students. | |||||
| 3. | Use of interactive activities to enhance learner engagement. | |||||
| 4. | Monitoringstudentprogressand providingsupporttostruggling learners. | |||||
| 5. | Recognition and celebration of student achievements. | |||||
| 6. | Promoting collaborative learning and peer interactions. | |||||
| 7. | Connectinglessonstoreal-life applicationstoincreasestudent interest. | |||||
| 8. | Using formative feedback to improve |
| student performance. | ||||||
| 9. | Encouraging independent learning and responsibility among students. | |||||
| 10. | Adjusting teaching methods to maximize studentparticipationand understanding. | |||||
| C. Assessment and Feedback Practices | ||||||
| Indicators | ||||||
| 1. | Design and implementation of varied assessment methods (tests, projects, portfolios). | |||||
| 2. | Timely and constructive feedback on student performance. | |||||
| 3. | Use of assessment results to guide instructional planning. | |||||
| 4. | Alignment of assessments with learning objectives and standards. | |||||
| 5. | Encouragementofstudentself-assessment and reflection. | |||||
| 6. | Fair and objective grading practices. | |||||
| 7. | Tracking students’ progress over time for continuous improvement. | |||||
| 8. | Communicatingassessmentresults effectively to students and parents. | |||||
| 9. | Integrating technology to enhance assessment and feedback processes.by supervisory staff. | |||||
| 10. | Using assessment to identify strengths, weaknesses, and learning gaps. | |||||
| D. Professional Growth and Accountability | ||||||
| Indicators | ||||||
| 1. | Participationinprofessional development activities and training. | |||||
| 2. | Willingness to learn new teaching strategies and integrate innovations. | |||||
| 3. | Commitmenttofulfillingassigned teaching responsibilities. | |||||
| 4. | Maintaining accurate and organized |
| instructional records. | ||||||
| 5. | Seeking feedback from supervisors and colleagues for improvement. | |||||
| 6. | Engaging in reflective practices to enhance teaching effectiveness. | |||||
| 7. | Activeinvolvementinschool improvement initiatives. | |||||
| 8. | Demonstrating ethical and responsible professional behavior. | |||||
| 9. | Taking initiative to address classroom and school challenges. | |||||
| 10. | Maintaining accountability for student learning outcomes. | |||||
| E. Community and Stakeholder Involvement | ||||||
| Indicators | ||||||
| 1. | Participationinschool-based community programs and activities. | |||||
| 2. | Collaboration with parents to support student learning. | |||||
| 3. | Engaging local stakeholders to enhance educational programs. | |||||
| 4. | Organizing or participating in outreach and extension projects. | |||||
| 5. | Incorporating community resources into classroom learning. | |||||
| 6. | Buildingpartnershipswithother schools or organizations. | |||||
| 7. | Encouraging students’ participation in community initiatives. | |||||
| 8. | Communicating effectively with community and stakeholders regarding student progress. | |||||
| 9. | Advocating for the welfare and needs of students in community settings. | |||||
| 10. | Supportingprogramsthatpromote school-community relations. |
Part V. Assessment of the Challenges Encountered Relative to the Digital Aptitudes, Professional Collaboration
and Administrative Support
Directions: Kindly put a check (/) mark in the space that corresponds to your answer on the challenges encountered using the scale below:
| Scale | Range | Verbal Interpretation | Symbol |
| 5 | 4.20 – 5.00 | Highly Encountered | HE |
| 4 | 3.40 – 4.19 | Encountered | E |
| 3 | 2.60 – 3.39 | Moderately Encountered | ME |
| 2 | 1.80 – 2.59 | Least Encountered | LE |
| 1 | 1.00 - 1.79 | Not Encountered | NE |
| A. Digital Aptitudes | 5 | 4 | 3 | 2 | 1 | |
| Indicators | ||||||
| 1. | Limited access to reliable internet connectivity for teaching and administrative tasks. | |||||
| 2. | Lack of sufficient digital devices (computers, tablets, or smartphones) for teachers and students. | |||||
| 3. | Insufficient training or orientation on emerging digital tools and platforms. | |||||
| 4. | Difficulty in integrating technology effectively into lesson plans. | |||||
| 5. | Low digital literacy among teachers, students, or non-teaching personnel. | |||||
| 6. | Challenges in managing online classroom activities and student participation. | |||||
| 7. | LimitedtechnicalsupportorIT assistance in school settings. | |||||
| 8. | Cybersecuritythreats,including phishing, malware, or data breaches. | |||||
| 9. | Inadequatedigitalresourcesor educational software for teaching. | |||||
| 10. | Difficulty adapting to new technologies or updates in digital platforms. | |||||
| B. ProfessionalCollaborationand Administrative Support |
| Indicators | ||||||
| 1. | Lack of clear communication channels between supervisors, school heads, and teachers. | |||||
| 2. | Insufficient support or guidance from school administrators on instructional or digital matters. | |||||
| 3. | Limited opportunities for collaborative planning or teamwork among staff. | |||||
| 4. | Conflicts or misalignment in shared vision and school goals. | |||||
| 5. | Low recognition or motivation for teacher achievements and contributions. | |||||
| 6. | Delays or inefficiencies in decision-making processes at the school or district level. | |||||
| 7. | Inadequateresourcestoimplement collaborative programs or initiatives. | |||||
| 8. | Challenges in providing professional development opportunities consistently. | |||||
| 9. | Resistance to change or innovation among staff members. | |||||
| 10. | Difficultybalancingadministrative duties with teaching responsibilities. |
Part VI. Assessment of the Suitability, Acceptability, and Feasibility of the Proposed Intervention Plan
Directions: This part contains list of items to describe the Suitability, Acceptability, and Feasibility of the Proposed Intervention Plan. Please put a check (/) mark on the space that corresponds your answer using the scale below.
| Scale | Range | Verbal Interpretation | Symbol |
| 5 | 4.20 -5.00 | Highly Suitable | HS |
| 4 | 3.40 -4.19 | Suitable | S |
| 3 | 2.60 -3.39 | Moderately Suitable | MS |
| 2 | 1.80 -2.59 | Least Suitable | LS |
| 1 | 1.00 -1.79 | Not Suitable | NS |
| A. Suitability | ||||||
| Indicators | 5 | 4 | 3 | 2 | 1 | |
| 1. | Addresses gaps in teachers’ digital aptitudes(e.g.,literacy, cybersecurity, instructional technology integration). | |||||
| 2. | Enhances professional collaboration and administrative support in schools. | |||||
| 3. | Improves teachers’ fulfillment in instructional delivery, learner engagement, assessment practices, and community involvement. | |||||
| 4. | Aligns with DepEd standards, curriculum requirements, and school improvement priorities. | |||||
| 5. | Promotes sustainable capacity-building practices for long-term educational outcomes. |
| Scale | Range | Verbal Interpretation | Symbol |
| 5 | 4.20 -5.00 | Highly Acceptable | HA |
| 4 | 3.40 -4.19 | Acceptable | A |
| 3 | 2.60 -3.39 | Moderately Acceptable | MA |
| 2 | 1.80 -2.59 | Least Acceptable | LA |
| 1 | 1.00 -1.79 | Not Acceptable | NA |
| B. Acceptability | ||||||
| Indicators | 5 | 4 | 3 | 2 | 1 | |
| 1. | Recognizedbysupervisors,school heads,teachers,andnon-teaching personnel as beneficial and practical. | |||||
| 2. | Encourages active participation and engagement of teachers in capacity-building activities. | |||||
| 3. | Supports the values, culture, and context of the Division of Pasig City public elementary schools. | |||||
| 4. | Endorsed by school leadership and aligns with teachers’ professional development needs. |
| 5. | Offersflexibleandadaptable strategies acceptable to diverse school personnel. |
| Scale | Range | Verbal Interpretation | Symbol |
| 5 | 4.20 -5.00 | Highly Feasible | HF |
| 4 | 3.40 -4.19 | Feasible | F |
| 3 | 2.60 -3.39 | Moderately Feasible | MF |
| 2 | 1.80 -2.59 | Least Feasible | LF |
| 1 | 1.00 -1.79 | Not Feasible | NF |
| C. Feasibility | ||||||
| Indicators | 5 | 4 | 3 | 2 | 1 | |
| 1. | Can be executed within available school resources, facilities, and technology. | |||||
| 2. | Requires manageable budget and time allocations for implementation. | |||||
| 3. | Supported by qualified facilitators, mentors, and administrative staff. | |||||
| 4. | Integrates effectively into the school calendar without disrupting instructional activities. | |||||
| 5. | Includesmonitoringandevaluation mechanismstoensuresuccessful execution and outcomes. |
Thank you!
NESTOR A. MADI JR.
Researcher
CURRICULUM VITAE
Nestor A. Madi Jr.
8a Green Street Munting Bahayan, Pinagbuhatan, Pasig City
Mobile #: 09052179942
Email Address: reignscore@gmail.com
PERSONAL DATA:
Age:40 years old Date of Birth :March 26, 1986
Place of Birth :Dagupan City, Pangasinan Civil Status:Single
Gender:Male
Religion:Roman Catholic Language Spoken:Filipino and English Father’s Name :Nestor A. Madi Sr.
Mother’s Name :Marilyn A. Madi
EDUCATIONAL BACKGROUND
Eulogio “Amang” Rodriguez Institute of Science and Technology
Nagtahan Sampaloc, Manila
Doctor of Education major in Educational Management November 2018- Present
Eulogio “Amang” Rodriguez Institute of Science and Technology
Nagtahan Sampaloc, Manila
Master of Arts in Education major in Administration and Supervision
May 2018
Pamantasan ng Lungsod ng Pasig
Alkalde Jose St. Brgy. Kapasigan, Pasig City Bachelor of Elementary Education
WORK EXPERIENCE
Ilugin Elementary School (SDO Pasig City) Address: Pinagbuhatan, Pasig City
Position: Teacher III
Duration: June 1, 2012- Present
St. Gabriel International School Address: Palatiw, Pasig City
Position: Grade School Social Studies Teacher Duration: June 1, 2007- March 31, 2012
I hereby declare that the above data are true, correct and accomplished with good faith to the best of my knowledge and belief.
Nestor A. Madi Jr.
References
- Acton, R., & Glasgow, P. (2024). Capacity development for teacher career sustainability. Palgrave Macmillan. Google Scholar ↗
- Bates, T. (2024). Instructional technology integration and online classroom management. Tony Bates Publications / Open Education Network. Google Scholar ↗
- Belicina, L. B. (2018). Basic statistics and research methods for education and social sciences. Rex Book Store. Google Scholar ↗
- Creswell, J. W. (2021). Research design: Qualitative, quantitative, and mixed methods approaches (5th ed.). Sage Publications. Google Scholar ↗
- Day, C. (2022). Sustaining teacher commitment and fulfillment in public education. Routledge. Google Scholar ↗
- Deci, E. L., & Ryan, R. M. (1985). Intrinsic motivation and self-determination in human behavior. Springer. Google Scholar ↗
- Evans, L. (2023). Institutional mechanisms and teacher professional fulfillment. Taylor & Francis. Google Scholar ↗
- Fullan, M., & Gallagher, M. (2022). Leadership as enablers of educational change. Corwin Press. Google Scholar ↗
- Hargreaves, A., & O’Connor, M. T. (2020). Authentic collaboration in schools: Foundations for innovation. Corwin Press. Google Scholar ↗
- Holmes, J., Patel, R., & Kim, S. (2023). Pearson’s product-moment correlation coefficient: Theory and applications. Statistics in Education Review, 17(1), 42–57. Google Scholar ↗
- Kelchtermans, G. (2021). Teacher fulfillment: Emotional and systemic perspectives. Routledge. Google Scholar ↗