Abstract
This study carried out a load-flow analysis of selected Nigerian hydroelectric power stations using available generator, transformer loading, and transmission-line data. The selected stations were Kainji, Jebba, and Shiroro located in the north-central region of Nigeria, while the network was simulated in MATPOWER using the Newton-Raphson method. Generator ratings, transformer parameters, line impedance, line charging, and load data were arranged into bus, generator, and branch matrices for steady-state power-flow analysis. The simulation converged after four iterations with a maximum mismatch of 4.68 × 10⁻¹³, showing that the model was suitable for analysis. The total active and reactive-power losses were 22.80 MW and 228.01 MVAr, respectively. Most buses operated within 0.95 to 1.05 p.u.; however, Jos and Gombe recorded low voltages, with Gombe being the weakest bus. The Jebba TS-Shiroro and Shiroro-Kaduna lines were overloaded. The study recommends voltage support, line reinforcement, and load redistribution to improve power transfer reliability. These findings provide valuable information for planning future improvements to the Nigerian hydro based transmission network.
Keywords
Load-flow analysis MATPOWER Newton-Raphson method voltage profile transmission-line loading.
1. Introduction
Electric power systems comprise generation, transmission, and distribution networks that work together to deliver electrical energy from generating stations to consumers efficiently and reliably. The operational reliability of transformers significantly influences overall power-system performance because inadequate cooling or insulation degradation may reduce equipment lifespan and network reliability [1]. The usefulness of generated electrical power depends on its ability to reach load centers with acceptable voltage levels, minimal losses, and safe equipment loading. Load flow analysis studies this condition by giving steady state values of bus voltage, voltage angle, active power flow, reactive power flow, line loading and system losses [2]. It also helps engineers know whether a network is operating within acceptable limits before reinforcement decisions are made. [3]
In Nigeria, load flow analysis is important because the transmission system still faces voltage drop, long line corridors and power loss challenges. Abdulkareem et al. [4] showed that Nigerian radial transmission networks can be examined using load-flow analysis to reveal bus voltage and loss conditions. Badrudeen et al. [5] reported that voltage weakness remains an issue in the Nigerian 330 kV network. Ugwu et al. [6] noted that Nigeria’s power sector requires stronger infrastructure, while Oyekale et al. [7] emphasized the importance of grid support studies.
Hydroelectric power stations such as Kainji, Jebba and Shiroro are important because they supply bulk power to the Nigerian grid. However, generation capacity alone does not mean that the network is secure. Weak buses, overloaded lines and reactive power losses can still occur when transmission lines are long or heavily loaded. Okampo et al. [8] showed that compensation studies are important in Nigerian transmission networks. Ratra et al. [9] linked voltage stability to line and bus conditions, while Salimon et al. [10] and Adegoke et al. [11] demonstrated that voltage profile and losses are affected by loading and power injection.
This study carries out load flow analysis of selected Nigerian hydroelectric power stations using available generator, transformer-loading and transmission-line data in MATPOWER. MATPOWER was used because it supports steady state power flow simulation with bus, generator and branch data [12]. The Newton-Raphson method was adopted because it is suitable for solving nonlinear power flow equations [13]. The study focuses on voltage profile, line loading, active power loss, and reactive-power loss. It does not cover short circuit analysis, transient stability, or frequency stability. The findings can support planning and voltage support decisions [14,15] and guide future grid strengthening efforts involving conventional and renewable generation. This is particularly relevant because increasing penetration of inverter-based renewable resources can introduce additional stability challenges. [16][18]
2. Method
2.1 Data Collection
This study utilized operational and network data from selected Nigerian hydroelectric power stations and their associated transmission substations. The hydroelectric power stations considered were Kainji, Jebba, and Shiroro, which are major hydroelectric generating stations located in the North-central region of Nigeria. The dataset comprised generator nameplate ratings, reactance and inertia constants, generator-transformer specifications, transmission line lengths and tower characteristics, transmission-line electrical parameters, per-unit branch parameters, and transformer loading data. These parameters formed the basis for developing the MATPOWER network model and conducting the load flow analysis. Simulation has become an essential tool in modern power engineering because it enables engineers to evaluate power-system behavior under different operating conditions without directly affecting the actual network. It provides a practical and cost effective approach for assessing system performance, identifying potential operational challenges, and supporting planning and network expansion decisions. In addition to conventional power-flow studies, simulation techniques have been widely applied in power system research to evaluate system performance under different operating conditions and support effective network planning and design [19]. MATPOWER was selected for this study because it is a widely used open-source toolbox developed for MATLAB and GNU Octave that supports steady state power flow and optimal power-flow analyses [12]. The runpf function is used to solve AC power-flow problems and, by default, employs the Newton Raphson method, making MATPOWER suitable for the steady state load flow analysis conducted in this study. [20]
2.2 Generator Data
The generator data used in this study were obtained from selected Nigerian hydroelectric power stations and their associated transmission substations. The hydroelectric stations considered were Kainji, Jebba, and Shiroro. The generator nameplate information presented in Table 1 includes the unit group, number of generating units, rated active power, total installed active power, power factor, apparent-power rating, and generator terminal voltage.
The generator nameplate ratings were used to establish the generating-capacity characteristics of the selected hydroelectric stations and to define the generator operating data required for the development of the MATPOWER network model. Kainji was represented by three generator unit groups, while Jebba and Shiroro were each represented by one unit group. The selected generator dataset represents a combined installed active-power capacity of 1,820 MW.
| Station | Type | Unit Group | No. of Units | MW/Unit | Total MW | Power Factor | MVA/Unit | Generator Voltage (kV) |
| Kainji | Hydro | 11-12 | 2 | 100 | 200 | 0.94 | 115 | 16 |
| Kainji | Hydro | 7-10 | 4 | 60 | 240 | - | 85 | 16 |
| Kainji | Hydro | 5-6 | 2 | 120 | 240 | 0.95 | 126 | 16 |
| Jebba | Hydro | 1-6 | 6 | 90 | 540 | 0.85 | 103.5 | 16 |
| Shiroro | Hydro | 1-4 | 4 | 150 | 600 | 0.85 | 176.5 | 16 |
The generator reactance and inertia constants presented in table 2 were retained as part of the technical dataset of the selected generating units. The direct focus of the study is steady-state load-flow analysis; therefore, these parameters were not treated as primary inputs to the conventional MATPOWER runpf calculation. The reactance values provide additional electrical characteristics of the generators, while the inertia constants are retained for completeness and may support future studies involving transient stability or dynamic generator behaviour.
| Station | Unit Group | X''d (p.u.) | X'd (p.u.) | Xd (p.u.) | Inertia Constant H (s) |
| Kainji | 11-12 | 0.2 | 0.26 | 0.72 | 3 |
| Kainji | 7-10 | 0.172 | 0.25 | 0.76 | 3 |
| Kainji | 5-6 | 0.22 | 0.3 | 0.9 | 3.23 |
| Jebba | 1-6 | 0.26 | 0.3 | 0.65 | 3 |
| Shiroro | 1-4 | 0.22 | 0.3 | 0.8 | 3.24 |
For the steady state load-flow model, the generator operating conditions were represented using the generator active power output, reactive-power limits where available, voltage set points, and corresponding bus assignments. These data were entered into the MATPOWER generator and bus matrices according to the network configuration of the selected stations and their associated transmission system. The generator ratings were also used to establish appropriate operating limits and to assess the relationship between generation, bus-voltage conditions, transmission-line loading, and system losses.
This approach ensured that the generator information used in the simulation was consistent with the available station data while maintaining a clear distinction between parameters required for steady-state load flow analysis and those primarily applicable to dynamic or transient studies.
2.3 Generator Transformer Data
The generator transformer data as shown in table 3 were used to represent the step-up transformers that connect the hydro generating units to the transmission network. Transformer rating, voltage ratio, and reactance were included because transformer impedance affects voltage drop, reactive power flow, and the transfer of generated power from the generator terminal to the network. In addition to electrical parameters, transformer operational reliability is strongly influenced by insulation quality and cooling effectiveness, making transformer condition an important consideration in power system performance. [21]
| Station | Unit Group | Transformer Rating | Transformer Voltage Ratio | Transformer Reactance XH-L (p.u.) |
| Kainji | 11-12 | 1 x 115 MVA | 16/330 kV | 0.104 |
| Kainji | 7-10 | 2 x 115 MVA | 16/330 kV | 0.104 |
| Kainji | 5-6 | 2 x 170 MVA | 16/330 kV | 0.083 |
| Jebba | 1-6 | 6 x 119 MVA | 12/132 kV | 0.1062 |
| Shiroro | 1-4 | 4 x 200 MVA | 15.2/330 kV | 0.130 |
2.4 Transmission-Line Data
The transmission line data in table 4 below were used to define the selected transmission corridors. Also, the line dataset in table 5 contained sending station, receiving station, tower type, number of circuits, line length, line rating, resistance, reactance, and line charging values. These values were converted into per-unit form for the MATPOWER branch matrix.
| Line No. | From Station | To Station | Tower Type | Length (km) |
| 1 | Birnin Kebbi | Kainji | Single circuit | 310 |
| 2 | Kainji | Jebba TS | Double circuit | 81 |
| 3 | Jebba TS | Jebba GS | Double circuit | 8 |
| 4 | Jebba TS | Shiroro | Single circuit | 244 |
| 5 | Shiroro | Abuja | Double circuit | 144 |
| 6 | Shiroro | Kaduna | Single circuit | 96 |
| 7 | Kaduna | Kano | Single circuit | 230 |
| 8 | Kaduna | Jos | Single circuit | 196 |
| 9 | Jos | Gombe | Single circuit | 264 |
| Line | From | To | Circuit | No. of Circuits | Length (km) | Rating (MVA/Circuit) | R (ohm/km) | X (ohm/km) | B (uS/km) | R Total (ohm) | X Total (ohm) | B Total (uS) |
| 1 | Birnin Kebbi | Kainji | Single | 1 | 310 | 240 | 0.03900 | 0.331 | 2.703 | 12.09 | 102.61 | 837.838 |
| 2 | Kainji | Jebba TS | Double | 2 | 81 | 240 | 0.03900 | 0.331 | 2.703 | 3.159 | 26.811 | 218.919 |
| 3 | Jebba TS | Jebba GS | Double | 2 | 8 | 480 | 0.03940 | 0.303 | 2.921 | 0.315 | 2.424 | 23.364 |
| 4 | Jebba TS | Shiroro | Single | 1 | 244 | 240 | 0.03900 | 0.331 | 2.703 | 9.516 | 80.764 | 659.46 |
| 5 | Shiroro | Abuja | Double | 2 | 144 | 777 | 0.03900 | 0.331 | 2.703 | 5.616 | 47.664 | 389.189 |
| 6 | Shiroro | Kaduna | Single | 1 | 96 | 777 | 0.03900 | 0.331 | 2.703 | 3.744 | 31.776 | 259.459 |
| 7 | Kaduna | Kano | Single | 1 | 230 | 777 | 0.03900 | 0.331 | 2.703 | 8.97 | 76.13 | 621.622 |
| 8 | Kaduna | Jos | Single | 1 | 196 | 777 | 0.03900 | 0.331 | 2.703 | 7.644 | 64.876 | 529.73 |
| 9 | Jos | Gombe | Single | 1 | 264 | 777 | 0.03900 | 0.331 | 2.703 | 10.296 | 87.384 | 713.514 |
The actual series impedance of each line was expressed as:
where R ij is the total line resistance and X ij is the total line reactance between buses i and j.
The per-unit impedance was obtained using:
For this study, the base quantities were S base = 100 MVA, V base = 330 kV, and Z base = 1089 ohm. The per-unit branch parameters used for the MATPOWER load-flow input is as presented in table 6 below.
| Line | From Station | To Station | Length (km) | No. of Circuits | R (p.u.) | X (p.u.) | B (p.u.) | Rating (MVA/Circuit) |
| 1 | Birnin Kebbi | Kainji | 310 | 1 | 0.01110 | 0.09422 | 0.912 | 240 |
| 2 | Kainji | Jebba TS | 81 | 2 | 0.00290 | 0.02462 | 0.238 | 240 |
| 3 | Jebba TS | Jebba GS | 8 | 2 | 0.00029 | 0.00223 | 0.02544 | 480 |
| 4 | Jebba TS | Shiroro | 244 | 1 | 0.00874 | 0.07416 | 0.718 | 240 |
| 5 | Shiroro | Abuja | 144 | 2 | 0.00516 | 0.04377 | 0.424 | 777 |
| 6 | Shiroro | Kaduna | 96 | 1 | 0.00344 | 0.02918 | 0.283 | 777 |
| 7 | Kaduna | Kano | 230 | 1 | 0.00824 | 0.06991 | 0.677 | 777 |
| 8 | Kaduna | Jos | 196 | 1 | 0.00702 | 0.05957 | 0.577 | 777 |
| 9 | Jos | Gombe | 264 | 1 | 0.00945 | 0.08024 | 0.777 | 777 |
2.5 Transformer Loading Data
The transformer loading data presented in table 7 were used to identify the loaded and unloaded substations represented in the MATPOWER network model. Substations with non zero transformer loading values were treated as load locations, while substations with zero transformer loading were retained in the network as buses without specified loads. Since the available data provided transformer loading values without corresponding reactive power demand, a lagging power factor of 0.90 was adopted to estimate the reactive power component of the loads.
| S/N | Region | Substation | Transformer Loading(MW) |
| 1 | Kaduna | Birnin Kebbi | 20 |
| 2 | Bauchi | Gombe | 120 |
| 3 | Kaduna | Gwagwalada | 0 |
| 4 | Bauchi | Jalingo | 0 |
| 5 | Bauchi | Jos | 240 |
| 6 | Kaduna | Jebba TS | 11.5 |
| 7 | Kaduna | Kaduna | 230 |
| 8 | Kaduna | Kano | 250 |
| 9 | Kaduna | Katampe | 270 |
| 10 | Bauchi | Makurdi | 0 |
| 11 | Bauchi | Maiduguri | 0 |
| 12 | Kaduna | Shiroro | 154 |
| 13 | Bauchi | Yola | 0 |
2.6 Load Preparation
For the MATPOWER load flow model, the available non zero transformer-loading values were treated as the active power demand at the corresponding load buses. A lagging power factor of 0.90 was assumed for all load buses because the available dataset did not provide separate reactive-power demand values.
Q= Ptan ( cos -1 (PF))(4)
Where Q is the reactive-power demand in MVAr, P is the active-power demand in MW, and PF is the power factor.
The resulting active and reactive-power demands used as load inputs for the MATPOWER model are presented in table 8.
| Load Bus | P Load (MW) | Q Load (MVAr) | Power Factor |
| Birnin Kebbi | 20 | 9.69 | 0.9 |
| Gombe | 120 | 58.12 | 0.9 |
| Jos | 240 | 116.24 | 0.9 |
| Jebba TS | 11.5 | 5.57 | 0.9 |
| Kaduna | 230 | 111.39 | 0.9 |
| Kano | 250 | 121.08 | 0.9 |
| Katampe | 270 | 130.77 | 0.9 |
| Shiroro | 154 | 74.59 | 0.9 |
2.7 Load-Flow Analysis in MATPOWER
The prepared data were converted into MATPOWER case-file format. MATPOWER uses structured bus, gen, and branch matrices for power flow simulation [12]. The bus matrix contained bus number, bus type, active load, reactive load, voltage magnitude, voltage angle, base voltage, and voltage limits. The generator matrix contained generator active-power output, voltage set point, apparent power base, and generator bus assignment. The branch matrix contained the sending bus, receiving bus, resistance, reactance, line charging, and branch rating.
The bus types were specified using the MATPOWER convention: PQ bus = 1, PV bus = 2, and slack bus = 3. Kainji was selected as the slack bus because it has the largest total capacity in the selected generator dataset. Jebba and Shiroro were represented as PV buses, while the remaining substations were represented as PQ buses. The runpf command was then used to solve the AC load-flow problem using the Newton method (Zimmerman & Murillo-Sanchez, 2024). Newton Raphson based load flow analysis has also been applied in Nigerian 330 kV radial transmission network studies, confirming its relevance for Nigerian transmission-system evaluation. [4]
The active and reactive-power injections at each bus were expressed as:
P i = Σ( ||V i || V j ||Y ij | cos( i - j - ij )) (5)
where P i and Q i are the active and reactive-power injections at bus i, V i and V j are bus-voltage magnitudes, Y ij is the bus-admittance matrix element, i and j are voltage phase angles, and ij is the admittance angle.
The power mismatch equations were expressed as:
The iterative solution continued until the active and reactive-power mismatches were within the specified convergence tolerance.
2.8 Performance Evaluation Criteria
The load flow result was evaluated using bus voltage magnitude, voltage angle, line loading, transformer loading, active power loss, and reactive-power loss. Voltage-based assessment is important in Nigerian transmission network studies because voltage weakness and stability limitations have been reported as major operating concerns in the Nigerian 330 kV power network. [5]
Bus-voltage magnitude was considered acceptable when it remained within the following range:
A bus-voltage below 0.95 p.u. was classified as a weak-voltage condition, while a branch or transformer loading value above 100% was classified as an overloaded condition. The voltage deviation index was also used to assess the overall voltage condition of the network:
where VDI is the voltage deviation index and V i is the voltage magnitude at bus i. A lower voltage deviation index indicates better voltage performance.
2.9 Simulation Conditions
The simulation was performed under steady state operating conditions. Transformer-loading values were treated as active load values, while reactive loads were computed using a lagging power factor of 0.90. The line resistance, reactance, and charging values were entered according to the transmission line parameter table. Double circuit lines were represented using the circuit information contained in the branch data. The analysis was limited to load flow simulation and did not include short-circuit analysis, transient stability, protection coordination, or frequency stability studies.
3. Results And Discussion
3.1 Simulation Workflow and Data-Based Result Overview
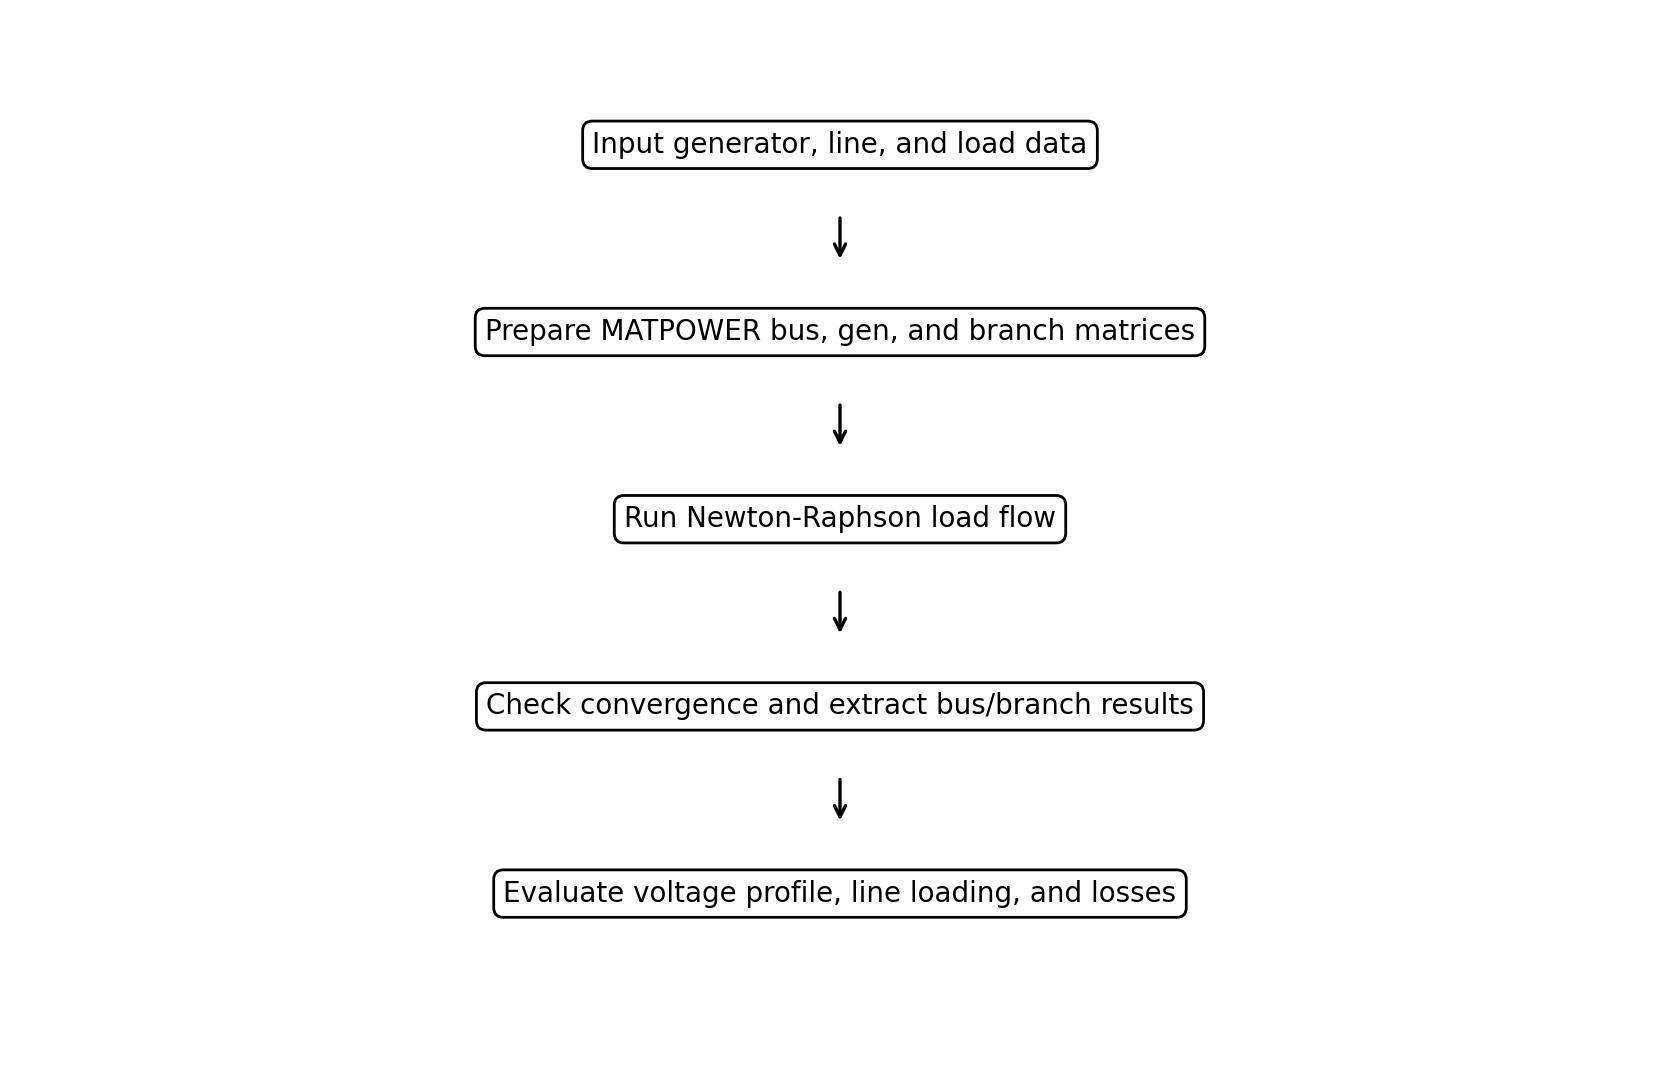
The load flow results were obtained from the MATPOWER-formatted Newton Raphson simulation prepared from the available generator, transformer loading, and transmission line data. The results are presented in two parts. The first part describes the data based profiles of the selected hydro stations, line lengths, and transformer loading. The second part presents the load flow output, including bus-voltage profile, line loading, active power loss, and reactive power loss.
3.2 MATPOWER Load-Flow Convergence Result
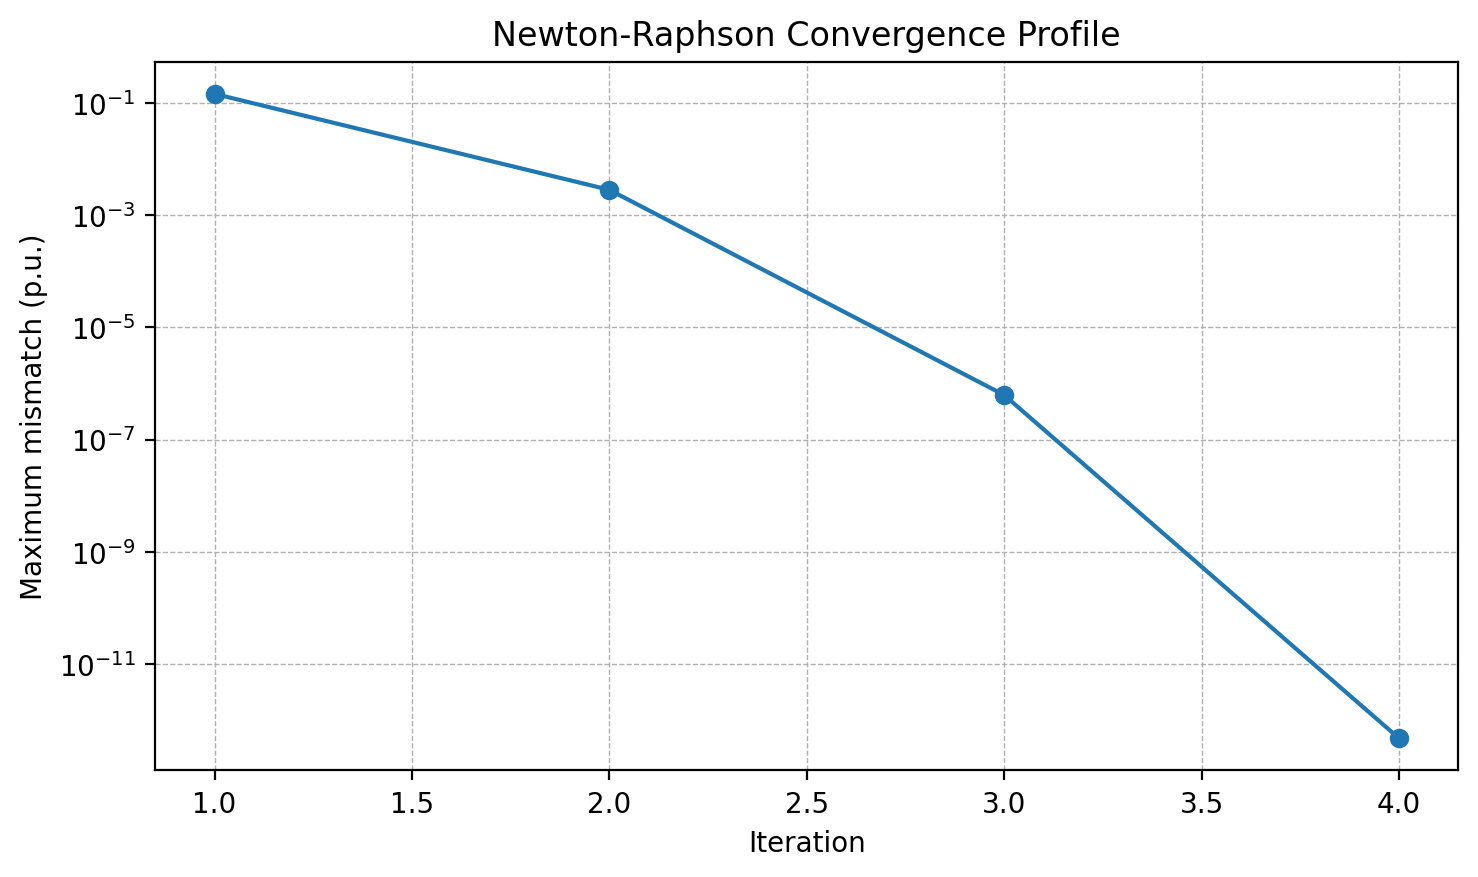
The Newton Raphson load flow solution as shown in table 9 and figure 2 converged after four iterations. The maximum mismatch at convergence was 4.68 x 10⁻¹³ p.u., which indicates that the bus power-balance equations were satisfied within the selected tolerance. The total active load was 1295.50 MW, while the total active generation was 1318.30 MW. The difference between generation and load represents the total active-power loss in the selected network.
| Parameter | Result |
| Simulation tool | MATPOWER |
| Solution method | Newton-Raphson |
| Convergence status | Converged |
| Iterations | 4 |
| Maximum mismatch (p.u.) | 4.68 x 10⁻¹³ |
| Total active load (MW) | 1295.50 |
| Total reactive load (MVAr) | 627.44 |
| Total active generation (MW) | 1318.30 |
| Total reactive generation (MVAr) | 855.45 |
| Total active power loss (MW) | 22.80 |
| Total reactive power loss (MVAr) | 228.01 |
3.3 Bus Voltage Profile Result
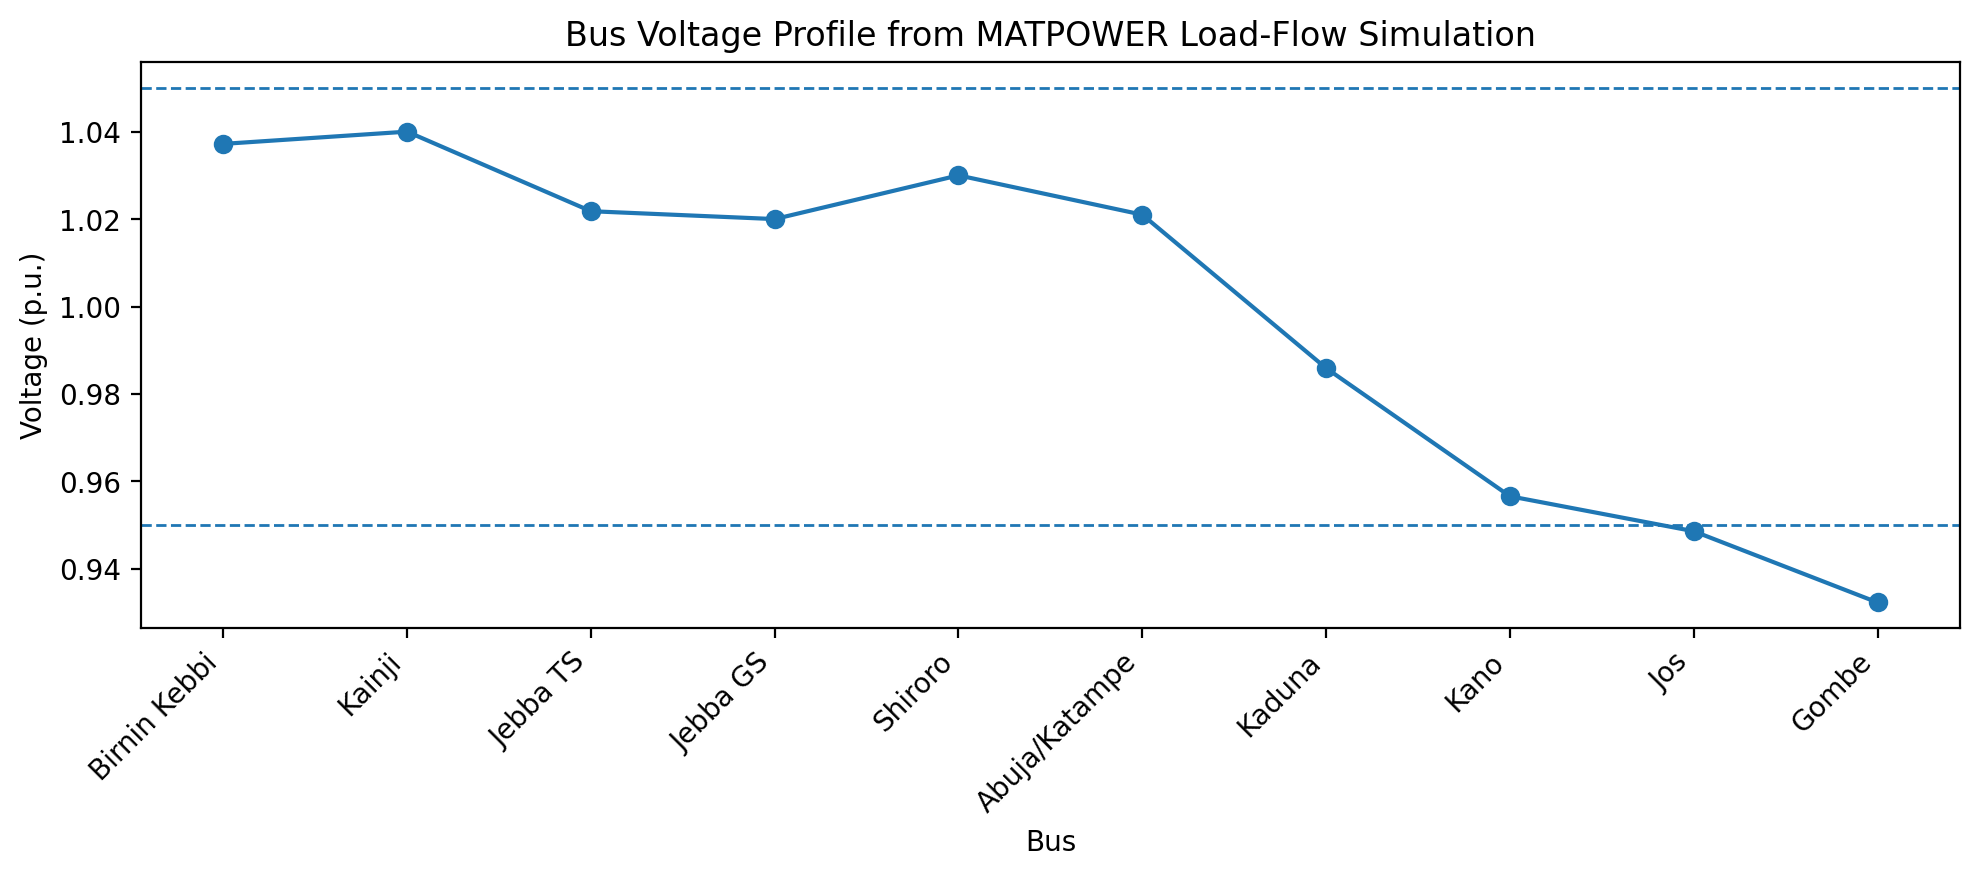
The bus voltage result in table 10 and figure 3 below showed which that most buses operated within the acceptable voltage range of 0.95 p.u. to 1.05 p.u. However, Jos and Gombe recorded voltages below 0.95p.u, indicating weak voltage conditions at those buses. The lowest voltage was recorded at Gombe with 0.9323p.u, followed by Jos with 0.9486p.u. The result indicates that the remote end of the Kaduna-Jos-Gombe corridor is the weakest part of the selected network.
| Bus | Type | Voltage (p.u.) | Angle (degree) | Load MW | Load MVAr | Remark |
| Birnin Kebbi | PQ | 1.0372 | -0.2520 | 20 | 9.6900 | Normal |
| Kainji | Slack | 1.0400 | 0 | 0 | 0 | Normal |
| Jebba TS | PQ | 1.0218 | -0.1780 | 11.5 | 5.5700 | Normal |
| Jebba GS | PV | 1.0200 | -0.0720 | 0 | 0 | Normal |
| Shiroro | PV | 1.0300 | -7.5870 | 154 | 74.59 | Normal |
| Abuja/Katampe | PQ | 1.0210 | -8.3970 | 270 | 130.77 | Normal |
| Kaduna | PQ | 0.9859 | -11.068 | 230 | 111.39 | Normal |
| Kano | PQ | 0.9566 | -13.74 | 250 | 121.08 | Normal |
| Jos | PQ | 0.9486 | -14.375 | 240 | 116.24 | Low voltage |
| Gombe | PQ | 0.9323 | -15.944 | 120 | 58.12 | Low voltage |
3.4 Transmission-Line Loading Result
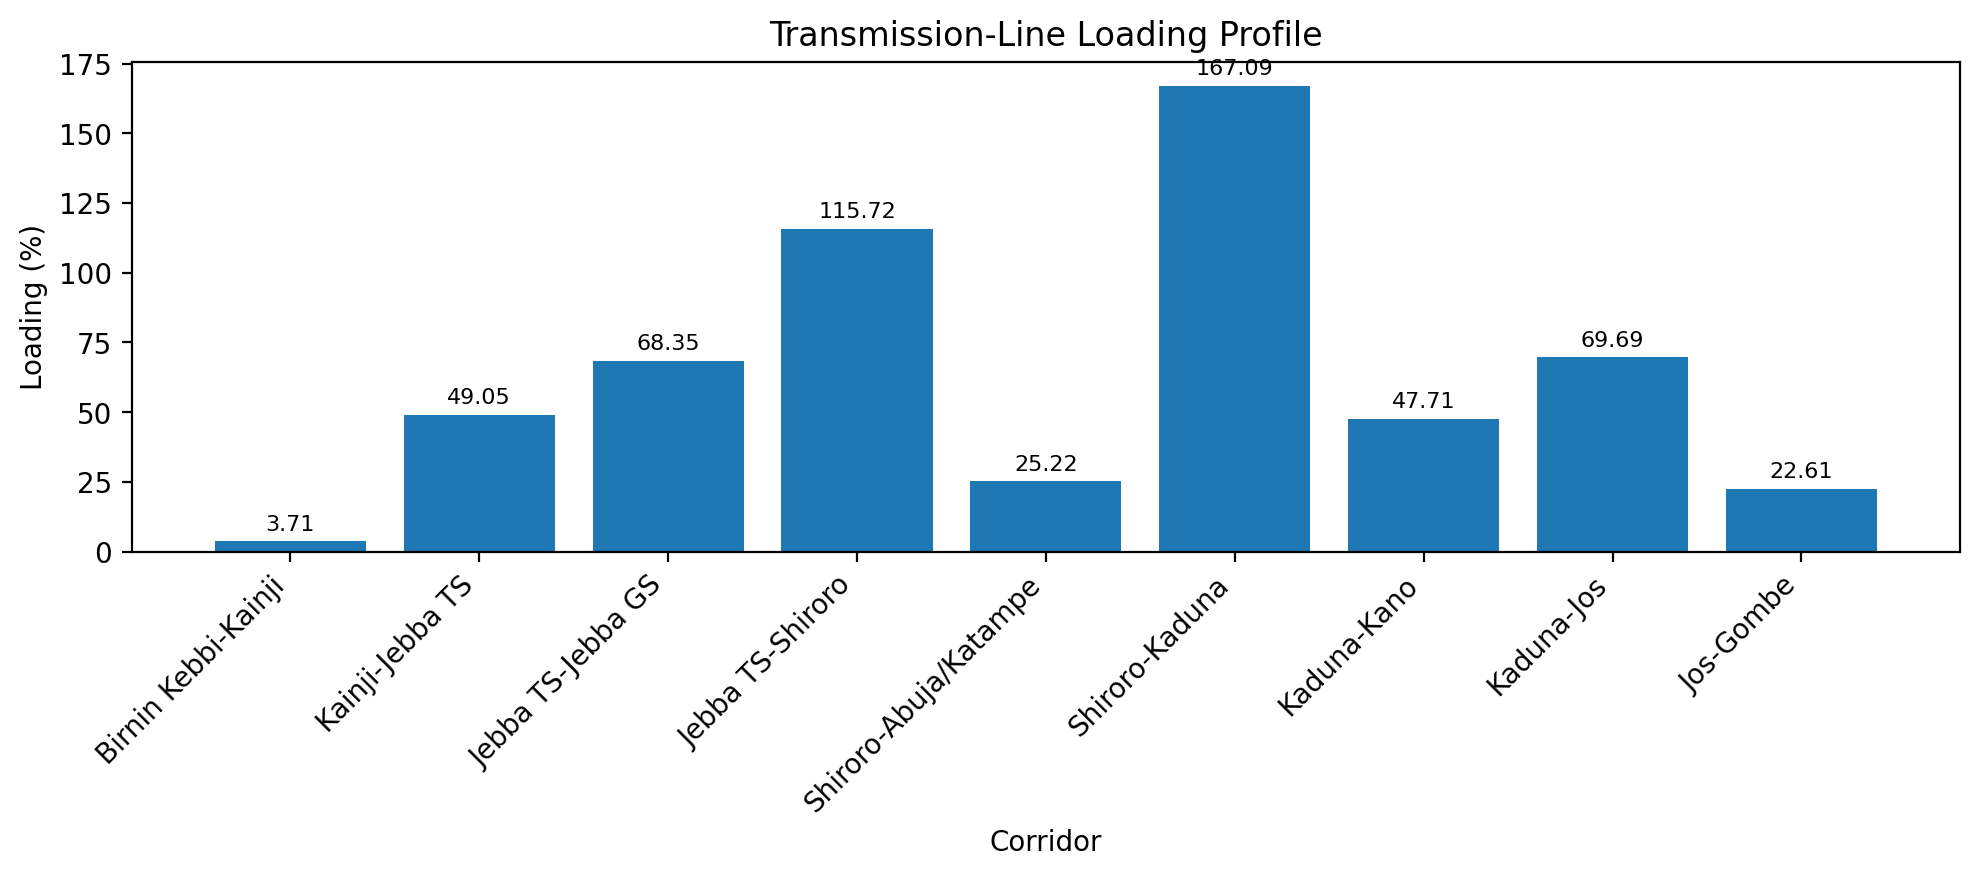
The line loading result indicates that two transmission corridors exceeded 100% loading. The Shiroro-Kaduna line recorded the highest loading at 167.09%, while the Jebba TS - Shiroro line recorded 115.72%. These values indicate that the two lines are overloaded under the simulated operating condition. Other lines remained below 100% loading.
| Line | From | To | Length km | Loading % | Remark |
| 1 | Birnin Kebbi | Kainji | 310 | 3.7100 | Normal |
| 2 | Kainji | Jebba TS | 81 | 49.05 | Normal |
| 3 | Jebba TS | Jebba GS | 8 | 68.35 | Normal |
| 4 | Jebba TS | Shiroro | 244 | 115.72 | Overloaded |
| 5 | Shiroro | Abuja/Katampe | 144 | 25.22 | Normal |
| 6 | Shiroro | Kaduna | 96 | 167.09 | Overloaded |
| 7 | Kaduna | Kano | 230 | 47.71 | Normal |
| 8 | Kaduna | Jos | 196 | 69.69 | Normal |
| 9 | Jos | Gombe | 264 | 22.61 | Normal |
3.5 Active and Reactive Power Loss Analysis
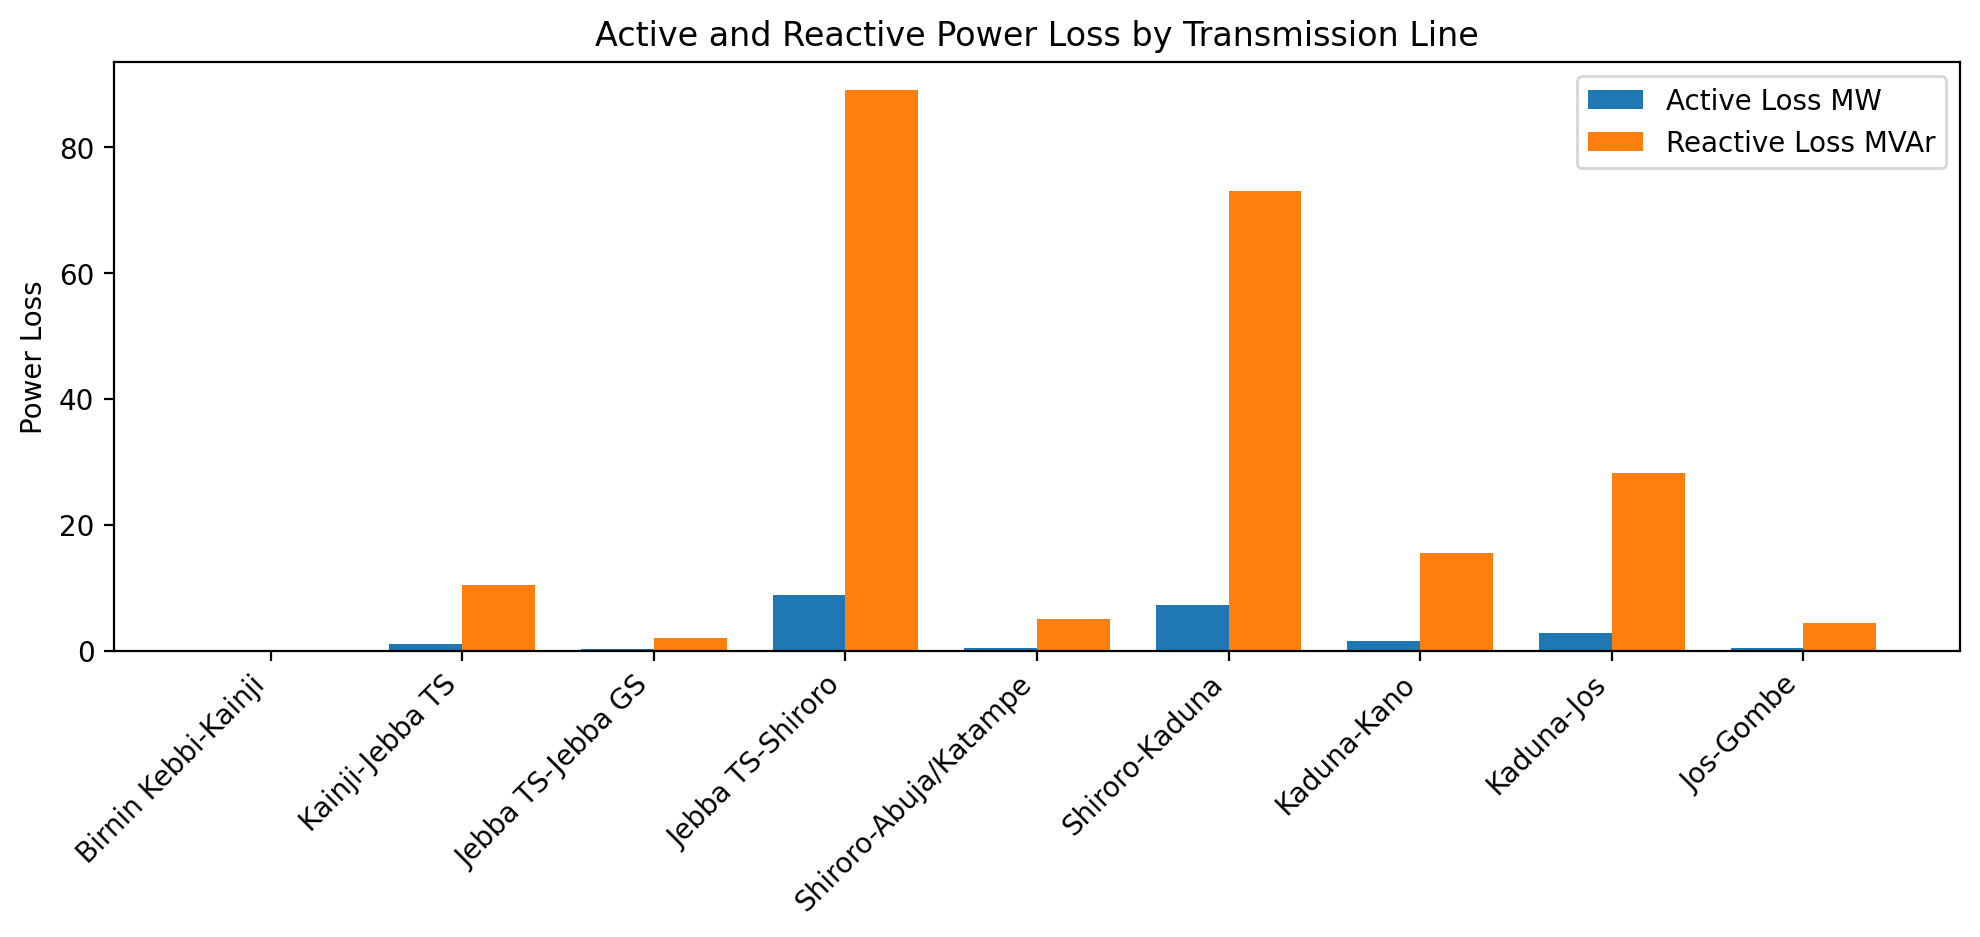
The total active power loss obtained from the simulation was 22.80 MW, while the total reactive-power loss was 228.01 MVAr. The Jebba TS-Shiroro corridor recorded the highest active-power loss of 8.909 MW and reactive-power loss of 89.087 MVAr. This was followed by the Shiroro-Kaduna corridor, with 7.308 MW active loss and 73.076 MVAr reactive loss is as shown in Table 12 below. The high losses on these corridors are consistent with their high loading values.
| Line | From | To | Active Loss MW | Reactive Loss MVAr |
| 1 | Birnin Kebbi | Kainji | 0.0110 | 0.1140 |
| 2 | Kainji | Jebba TS | 1.0420 | 10.423 |
| 3 | Jebba TS | Jebba GS | 0.2070 | 2.0710 |
| 4 | Jebba TS | Shiroro | 8.9090 | 89.087 |
| 5 | Shiroro | Abuja/Katampe | 0.5000 | 4.9950 |
| 6 | Shiroro | Kaduna | 7.3080 | 73.076 |
| 7 | Kaduna | Kano | 1.5580 | 15.583 |
| 8 | Kaduna | Jos | 2.8330 | 28.325 |
| 9 | Jos | Gombe | 0.4340 | 4.3390 |
3.6 Overall Load-Flow Performance Summary
The overall result in figure 13 shows that the selected hydro based network is capable of achieving load flow convergence, but the voltage and loading profiles reveal operating weaknesses. The weakest bus is Gombe, while the most overloaded line is Shiroro-Kaduna. The results suggest that voltage support and line reinforcement may be required around the Jos-Gombe and Shiroro-Kaduna corridors to improve the steady-state operating condition of the selected network.
| Performance Indicator | Result |
| Weakest bus | Gombe |
| Minimum bus voltage | 0.9323 p.u. |
| Second weakest bus | Jos |
| Most overloaded line | Shiroro-Kaduna |
| Maximum line loading | 167.09% |
| Total active power loss | 22.80 MW |
| Total reactive power loss | 228.01 MVAr |
| Voltage-violated buses | Jos and Gombe |
| Overloaded lines | Jebba TS-Shiroro and Shiroro-Kaduna |
| Load-flow status | Converged |
4. Discussion
From the load flow result, the selected Nigerian hydro-based network was able to operate under steady state condition because the Newton Raphson load flow solution converged after four iterations. This shows that the MATPOWER model developed from the available generator data, transformer loading data, and transmission line parameters was suitable for the analysis. The total active load considered in the system was 1295.5 MW, while the reactive load was 627.44 MVAr. To supply this load, the system generated 1318.30 MW and 855.45 MVAr. The difference between the generation and the load gave a total active-power loss of 22.80 MW and reactive-power loss of 228.01 MVAr. This shows that the reactive-power loss was higher than the active-power loss, which means that reactive-power demand had a strong effect on the system performance.
The voltage profile result showed that most of the buses operated within the acceptable voltage range of 0.95 p.u. to 1.05p.u. However, the Jos and Gombe buses recorded low voltage values of 0.9486p.u. and 0.9323p.u, respectively. Among all the buses, Gombe had the lowest voltage, which means it was the weakest bus in the network. This may be due to the long transmission distance, loading condition, and reactive-power demand along the Kaduna-Jos-Gombe section of the system. Therefore, reactive-power compensation or voltage-support devices may be required around Jos and Gombe to improve the voltage level.
The line-loading result also showed that some transmission corridors were heavily loaded. The Jebba TS-Shiroro line was loaded at 115.72%, while the Shiroro-Kaduna line was loaded at 167.09%. Since these values are above 100%, the two lines can be considered as overloaded. The Shiroro-Kaduna line was the most critical line in the system. This operating condition can increase transmission losses, produce thermal stress on conductors, and reduce overall network reliability.
Overall, the results show that the selected hydro-based system can supply the connected load, but there are weak buses and overloaded lines that require attention. Therefore, system improvement measures such as line reinforcement, voltage compensation, transformer tap adjustment, or load redistribution may be needed to improve the voltage profile, reduce losses, and ensure more reliable power transfer. Such measures are also relevant to future grid-strengthening efforts, particularly as renewable integration introduces additional power-system stability challenges [18].
5. Conclusion
In conclusion, this study carried out a load-flow analysis of selected Nigerian hydroelectric power stations using available generator, transformer-loading, and transmission-line data. The MATPOWER results showed that the system converged under steady-state conditions, confirming the suitability of the developed model for the analysis. Most buses operated within the acceptable voltage range of 0.95 p.u. to 1.05 p.u., corresponding to approximately 95% to 105% of the rated bus voltage. For a 330 kV bus, this range corresponds to approximately 313.5 kV to 346.5 kV. However, the Jos and Gombe buses recorded relatively weak voltage levels, with Gombe identified as the weakest bus in the network. The overloaded transmission lines further indicate the need for network reinforcement, voltage support, and improved power-transfer capability.
Future improvements in the Nigerian electricity network could enhance transmission reliability and support the wider deployment of renewable-energy-powered automated systems in laboratories, health care facilities, and other critical infrastructures that depend on stable and reliable electricity supply [21]. Such developments could contribute to a more resilient and sustainable power sector capable of supporting both conventional transmission networks and emerging clean-energy applications.
References
- Akpomedaye O, Erokare ET, Akwenuke OM, Uguru H. Evaluation of the impact of green antioxidants on the functionality of power transformer bio-coolants. Appl J Phys Sci. 2025;6(2):44-49. DOI ↗ Google Scholar ↗
- El-Fergany AA. Reviews on load-flow methods in electric distribution networks. Arch Comput Methods Eng. 2025;32:1619-1633. DOI ↗ Google Scholar ↗
- Glover JD, Overbye TJ, Sarma MS. Power system analysis and design. 6th ed. Cengage Learning; 2017. DOI ↗ Google Scholar ↗
- Abdulkareem A, Alayande AS, Somefun TE, Ette EV. Investigating the effects of bus numbering in a radial transmission network using load-flow study. Heliyon. 2021;7(5):e07098. DOI ↗ Google Scholar ↗
- Badrudeen TU, Ariyo FK, Gbadamosi SL, Nwulu NI. A novel classification of the 330 kV Nigerian power network using a new voltage stability pointer. Energies. 2022;15(19):7247. DOI ↗ Google Scholar ↗
- Ugwu J, Odo KC, Oluka LO, Salami KO. A systematic review on the renewable energy development, policies and challenges in Nigeria with an international perspective and public opinions. Int J Renew Energy Dev. 2022;11(1):287-308. DOI ↗ Google Scholar ↗
- Oyekale J, Petrollese M, Tola V, Cau G. Impacts of renewable energy resources on effectiveness of grid-integrated systems: succinct review of current challenges and potential solution strategies. Energies. 2020;13(18):4856. DOI ↗ Google Scholar ↗
- Okampo EJ, Nwulu NI, Bokoro PN. Transient stability analysis of a transmission network using eigenvalue principles with automated VAR compensation: a case study of the Nigerian Eastern Grid. Energies. 2021;14(17):5289. DOI ↗ Google Scholar ↗
- Ratra S, Tiwari R, Niazi KR. Voltage stability assessment in power systems using line voltage stability index. Comput Electr Eng. 2018;70:199-211. DOI ↗ Google Scholar ↗
- Salimon SA, Adepoju GA, Adebayo IG, Howlader HOR, Ayanlade SO, Adewuyi OB. Impact of distributed generators penetration level on the power loss and voltage profile of radial distribution networks. Energies. 2023;16(4):1943. DOI ↗ Google Scholar ↗
- Adegoke SA, Sun Y, Adegoke AS, Ojeniyi D. Optimal placement of distributed generation to minimize power loss and improve voltage stability. Heliyon. 2024;10(21):e39298. DOI ↗ Google Scholar ↗
- Zimmerman RD, Murillo-Sánchez CE, Thomas RJ. MATPOWER: steady-state operations, planning, and analysis tools for power systems research and education. IEEE Trans Power Syst. 2011;26(1):12-19. DOI ↗ Google Scholar ↗
- Tebbakh N, Labed D. Load-flow analysis using Newton-Raphson method in presence of distributed generation. Int J Power Electron Drive Syst. 2021;12(1):489-498. DOI ↗ Google Scholar ↗
- Absar MN, Islam MF, Ahmed A. Power quality improvement of a proposed grid-connected hybrid system by load-flow analysis using static var compensator. Heliyon. 2023;9:e17915. DOI ↗ Google Scholar ↗
- Sharma V, Aziz SM, Haque MH, Kauschke T. Effects of high solar photovoltaic penetration on distribution feeders and the economic impact. Renew Sustain Energy Rev. 2020;131:110021. DOI ↗ Google Scholar ↗
- Ayalew M, Khan B, Giday I, Mahela OP, Khosravy M, Gupta N, et al. Integration of renewable based distributed generation for distribution network expansion planning. Energies. 2022;15(4):1378. DOI ↗ Google Scholar ↗
- Sinsel SR, Riemke RL, Hoffmann VH. Challenges and solution technologies for the integration of variable renewable energy sources: a review. Renew Energy. 2020;145:2271-2285. DOI ↗ Google Scholar ↗
- Idiode K, Oji IC, Osuagwu IC, Akpobigho KK. Adaptive sliding mode control for stability enhancement of grid-forming converters in renewable-dominated microgrids. Iconic Res Eng J. 2026;9(10):1199-1206. DOI ↗ Google Scholar ↗
- Okuyade OS, Akpomedaye O, Enudi M, Mene JA. Modelling and simulation of transient electric field in HVDC insulation system. Int J Eng Process Saf Res. 2025;8(5). DOI ↗ Google Scholar ↗
- Zimmerman RD, Murillo-Sánchez CE. MATPOWER user's manual: version 8.0. MATPOWER; 2024. DOI ↗ Google Scholar ↗
- Akpomedaye O, Aki AO, Uguru H. Designing a green laboratory: automated refrigeration system powered by renewable energy. Scholarly J Sci Technol Res Dev. 2025;4(2):1-6. DOI ↗ Google Scholar ↗