Abstract
Objective University students in higher education, and in the Labé region of Guinea in particular, remain understudied from a nutritional standpoint. This study set out to describe dietary habits and assess the nutritional status of undergraduate students at the Faculty of Science and Technology (FST), University of Labé, and to identify the factors associated with it. Methods We conducted a descriptive, analytical cross-sectional study among 129 undergraduate students (years 1-3), recruited through stratified systematic random sampling. For each participant we collected socio-demographic, anthropometric (weight, height, body mass index [BMI], mid-upper arm circumference [MUAC]), behavioural and dietary data, together with clinical and biological parameters (blood pressure, capillary glycaemia, haemoglobin level). Nutritional status was classified using WHO BMI cut-offs and anaemia using sex-specific WHO haemoglobin thresholds. Associations were tested with Pearson's Chi-square test, Student's t-test and Pearson correlation, at a significance threshold of P < 0.05. Results The 129 participants comprised 80 men (62.0%) and 49 women (38.0%), with a mean age of 22.5 ± 1.9 years. Mean BMI was 20.8 ± 3.5 kg/m², closely correlated with MUAC (r = 0.77; P < 0.001). Just over a third of students (38.0%) showed some form of malnutrition: 26.4% were thin, 10.9% overweight and 0.8% obese. Women carried a heavier double burden than men, combining more thinness (28.6% vs 25.0%) and more overweight/obesity (20.4% vs 6.2%; χ² = 7.43; P = 0.059). More than half the sample (57.4%) skipped breakfast, and 69.0% ate only two meals a day. Fruit, pulses and dairy products were eaten daily by only 36.4%, 13.2% and 10.1% of students respectively, whereas cereals (93.8%) and fats (85.3%) were consumed almost universally. Anaemia affected 28.7% of students (36.7% of women vs 23.8% of men; P = 0.167), and 13.4% had hypertension. Conclusion Students at the University of Labé face a double nutritional burden, combining thinness and overweight, compounded by a notable prevalence of anaemia, against a backdrop of unbalanced eating habits: skipped breakfasts, too few meals, and too little fruit, pulses or dairy. These findings point to a clear need for nutrition education and better-adapted catering within Guinean universities.
Keywords
dietary habits nutritional status body mass index anaemia mid-upper arm circumference university students Guinea.
1. Introduction
Across sub-Saharan Africa, the nutrition transition has produced an uneasy overlap: undernutrition and overweight now coexist within the same populations, sometimes even within the same person at different points in life. This phenomenon is called the “double burden of malnutrition” by experts, and it is an increasing problem that now includes populations that were once thought of as low-risk, such as university students [1,2]. Starting college usually means a sudden change in eating habits. Young adults leave their family homes, take charge of their own meals for the first time, handle tight budgets, and adapt to intense academic schedules that offer little time for organised eating. It's no surprise that many end up skipping meals, relying on snacks, and consuming few fruits and vegetables [2,3]. A large study across 28 countries involving 21,958 students revealed that about 48% regularly skipped breakfast, a behaviour tied to feeling overweight and lack of physical activity [3]. In Cameroon, a survey at three public universities found 29.4% of medical students faced some form of malnutrition, with 4.9% underweight, 21.6% overweight, and 3.0% obese [2]. Similarly, students in coastal Kenya showed a disconnect between knowledge and practice: despite understanding good nutrition, their actual diets lacked sufficient animal-source foods, fruits, and vegetables [4]. Body weight is only part of the picture, though. Micronutrient deficiencies, and anaemia in particular, are a persistent problem among young adults on African university campuses. In one striking example, a cohort of Ghanaian students saw anaemia prevalence more than double over a single academic year, rising from 20% to 45%, as their eating habits deteriorated on campus [5]. Guinea’s own nutrition data are largely focused on young children, pregnant women and, more recently, older adults [12]. The first nationally representative survey of older persons showed a distinct regional pattern of undernutrition in the Labé region, at nearly double the national average (standardised prevalence ratio of 1.97) [6]. That finding raises an obvious question: is this regional susceptibility confined to the elderly or does it extend to other groups, including students? At the University of Labé, no data existed to answer this before the present study. We therefore set out to assess how dietary habits relate to the nutritional status of undergraduate students at the Faculty of Science and Technology, University of Labé. More specifically, we aimed to: (i) describe the socio-demographic, anthropometric and behavioural profile of the study population; (ii) determine the prevalence of the different BMI-based nutritional categories; (iii) describe dietary habits, including meal patterns and food-group consumption frequency; (iv) describe key clinical and biological parameters, namely blood pressure, glycaemia and haemoglobin; and (v) identify the socio-demographic and behavioural factors associated with nutritional status.
2. Materials And Methods
2.1. Study Design, Setting and Period
This was a descriptive and analytical cross-sectional study conducted within the Department of Applied Biology, Faculty of Science and Technology (FST), University of Labé, Republic of Guinea. Data collection took place from 1 June to 31 July 2026, in the department's teaching laboratory, as part of a doctoral research project.
2.2. Study Population and Sampling
The source population comprised all undergraduate students regularly enrolled at the FST, a total of 1,290 students, comprising 872 men (67.5%) and 418 women (32.5%). To ensure representativeness of both sexes and to limit selection bias, a stratified systematic random sampling technique was used, with the source population divided into two homogeneous strata by sex (male and female strata). Within each stratum, a fixed sampling fraction of 1/10 (10% sampling rate) was applied: the list of students in each stratum was divided into consecutive blocks of 10 individuals, from which one individual was randomly drawn. This procedure yielded a theoretical sample of 129 students, comprising 87 men (from the 872 men) and 42 women (from the 418 women). Each sub-sample was then allocated across the faculty's five departments (approximately 17 students per department for the male sub-sample), and each head of department was asked to mobilise the designated students, who were received individually in the data-collection room. Upon completion of field recruitment, the final sample analysed comprised, as planned, 129 students, although with a sex distribution slightly different from the theoretical target (80 men and 49 women instead of 87 men and 42 women), possibly related to differences in availability or response rate between departments and by sex at the time of recruitment. The final sample composition was therefore: 80 men and 49 women, comprising 72 year-1 students (55.8%), 33 year-2 students (25.6%) and 24 year-3 students (18.6%).
2.3. Variables and Data Collection Instruments
Data were collected using a structured questionnaire and anthropometric and biological measurements, covering four domains: (i) Socio-demographic characteristics: age, sex, marital status, year of study, type of accommodation, source of income, perceived living conditions; (ii) Anthropometric characteristics: weight (kg), height (m), body mass index (BMI = weight/height², kg/m²), and mid-upper arm circumference (MUAC, cm); (iii) Behavioural and dietary habits: practice and frequency of physical activity, alcohol, tobacco, tea/coffee consumption, number of meals per day, breakfast consumption, frequency of consumption (daily, weekly, monthly, never) of nine food groups (milk and dairy products, cereals and starches, pulses, meat/fish/eggs, fruit, vegetables, fats, sugary products, carbonated drinks); (iv) Clinical and biological parameters: blood pressure (mmHg), capillary glycaemia (g/L), and haemoglobin level (g/dL), measured at the time of the survey. The Anthropometric and the clinical instruments were calibrated before data collection. Weight and height were measured with a combined scale-stadiometer (ADE), zeroed before each measurement session. Mid-upper arm circumference was measured with a Shakir tape (FEFA), read on its plain white (non-colour-coded) ribbon. Blood pressure was measured with a calibrated electronic blood pressure monitor (Shanghai Brother Medical Manufacturer Co., Ltd., model BME001). Capillary glycaemia was measured with an electronic glucometer (SD-Chek), calibrated beforehand, on a fasting capillary blood sample. Haemoglobin was measured with a HemoCue Mission Hb point-of-care analyser, with automatic device calibration, on a capillary blood sample.
2.4. Operational Definitions
Operational definitions are defined as follows: (i) Nutritional status by BMI (WHO criteria): thinness for BMI < 18.5 kg/m²; normal weight for 18.5 ≤ BMI < 25 kg/m²; overweight for 25 ≤ BMI < 30 kg/m²; obesity for BMI ≥ 30 kg/m² [7]. (ii) Anaemia: haemoglobin < 12 g/dL in women and < 13 g/dL in men using the WHO thresholds [8]. (iii) Hypertension: systolic blood pressure ≥ 140 mmHg and/or diastolic ≥ 90 mmHg; hypotension if systolic < 90 mmHg or diastolic < 60 mmHg. (iv) Glycaemic abnormality: hypoglycaemia if glycaemia < 0.70 g/L; hyperglycaemia if glycaemia > 1.10 g/L; values between these thresholds considered normal.
2.5. Statistical Analysis
Data were extracted, cleaned and analysed using Python (pandas, SciPy) and Microsoft Excel. Quantitative variables were described as mean ± standard deviation (SD) and compared using Student's t-test; qualitative variables were described as frequencies and percentages and compared using Pearson's Chi-square test (or exact test where expected cell counts were < 5). Pearson’s correlation coefficient (r) was employed to assess the relationships between quantitative variables. Statistical significance was set at P < 0.05. Two biologically implausible values, one for blood pressure and one for glycaemia, were identified as potential data entry errors and recoded as missing. The sample size (n) for each affected variable is clearly indicated. Confidence intervals for proportions were calculated using Wilson score method. 95% CIs are presented in brackets throughout the results tables. To assess whether the association between sex and nutritional status persisted after accounting for other socio-demographic and behavioural factors, we additionally fitted a multivariable logistic regression model (malnutrition, i.e. any BMI category other than normal weight, as the binary outcome), adjusting for sex, age, breakfast consumption, physical activity, type of accommodation and year of study; results are reported as adjusted odds ratios (aOR) with 95% confidence intervals. All analyses are fully reproducible from the raw data (supplementary Data S1): the Python script implementing every statistical test and the regression model is provided as Supplementary Data S2.
2.6. Ethical Considerations
Data collection was formally authorised by the Vice-Dean for Research of the Faculty of Science and Technology, University of Labé (Data Collection Authorisation Note No. 008/UL/FST/VD-R/2026, dated 30 May 2026), as part of the corresponding author's [sic, first author's] doctoral research. Student participation was voluntary and preceded by informed consent; data were handled anonymously and confidentially, in strict accordance with research ethics rules. Full details are provided in the Declarations section.
3. Results
3.1. Socio-demographic Characteristics
Of the 129 students included, 80 were male (62.0%) and 49 were female (38.0%), a male-to-female ratio of 1.6. The mean age of the whole sample was 22.5 ± 1.9 years (range: 18-27 years); men were significantly older than women (23.0 ± 1.9 years vs 21.8 ± 1.7 years; t = 3.81; P < 0.001). Detailed socio-demographic characteristics are presented in Table 1. Most students were single, making up 91.5% of the group, and the age distribution followed a predictable pattern: over half were in their first year, with much smaller numbers in the second and third years, showing how student numbers tend to drop as people progress through the programme. The most frequently used housing option was off-campus rentals, which was used by 58.1% of the students. A high percentage lived with their families and only 14% lived in university dormitories. This shows a lack of on-campus housing or preference for other housing. Most were financially supported by their families – 80.6% were supported by parents with a maintenance grant. Some managed to scrape by with money from both parents and money they earned themselves. But a small minority, just 7.8 per cent, survived on their own income and a grant without any parental support. Feelings about their living situations varied. Less than half thought their conditions were acceptable, around a third described them as average, and a notable 6.2% felt they were in a precarious situation, underscoring that financial pressure is a real and ongoing challenge for some students alongside their academic workload.
This table presents the socio-demographic characteristics of the 129 students included in the study, as number (n) and percentage (%) of the total sample. Values in square brackets are 95% confidence intervals (95% CI) for each proportion, calculated using the Wilson score method. N: total number of students analysed.
| Variable | n | % |
|---|---|---|
| Sex — Male | 80 | 62.0 [95% CI 53.4-69.9] |
| Sex — Female | 49 | 38.0 [95% CI 30.1-46.6] |
| Year of study — Year 1 | 72 | 55.8 [95% CI 47.2-64.1] |
| Year of study — Year 2 | 33 | 25.6 [95% CI 18.8-33.7] |
| Year of study — Year 3 | 24 | 18.6 [95% CI 12.8-26.2] |
| Marital status — Single | 118 | 91.5 [95% CI 85.4-95.2] |
| Marital status — Married | 10 | 7.8 [95% CI 4.3-13.7] |
| Marital status — Divorced | 1 | 0.8 [95% CI 0.1-4.3] |
| Accommodation — Rented | 75 | 58.1 [95% CI 49.5-66.3] |
| Accommodation — Family home | 36 | 27.9 [95% CI 20.9-36.2] |
| Accommodation — University dormitory | 18 | 14.0 [95% CI 9.0-21.0] |
| Income source — Parents and maintenance grant | 104 | 80.6 [95% CI 73.0-86.5] |
| Income source — Parents and personal income | 12 | 9.3 [95% CI 5.4-15.6] |
| Income source — Personal income and grant | 10 | 7.8 [95% CI 4.3-13.7] |
| Income source — Other | 3 | 2.3 [95% CI 0.8-6.6] |
| Perceived living conditions — Acceptable | 59 | 45.7 [95% CI 37.4-54.3] |
| Perceived living conditions — Average | 46 | 35.7 [95% CI 27.9-44.2] |
| Perceived living conditions — Good | 16 | 12.4 [95% CI 7.8-19.2] |
| Perceived living conditions — Precarious | 8 | 6.2 [95% CI 3.2-11.8] |
3.2. Anthropometric Characteristics and Nutritional Status
Mean weight was 59.3 ± 10.0 kg (range: 36-87 kg) and mean height was 1.69 ± 0.08 m (range: 1.48-1.86 m); men were, unsurprisingly on biological grounds, heavier (61.0 ± 8.7 kg vs 56.6 ± 11.3 kg; P = 0.024) and taller (1.73 ± 0.06 m vs 1.62 ± 0.07 m; P < 0.001) than women (Table 2). Mean BMI for the whole sample was 20.8 ± 3.5 kg/m² (range: 13.7-38.7 kg/m²), with no statistically significant difference between men (20.3 ± 2.5 kg/m²) and women (21.5 ± 4.6 kg/m²; t = -1.65; P = 0.104), the weight-to-height ratio broadly compensating between sexes. Mean MUAC was 26.2 ± 2.9 cm, with no significant difference between men (26.5 ± 2.5 cm) and women (25.6 ± 3.6 cm; P = 0.110), and was strongly and positively correlated with BMI (r = 0.77; P < 0.001), confirming its relevance as a complementary anthropometric indicator in this setting, consistent with data reported in other African populations [9][10]. According to WHO BMI cut-offs, 80 students (62.0%) had normal weight, while 34 (26.4%) had thinness, 14 (10.9%) were overweight and 1 (0.8%) had obesity, giving an overall malnutrition prevalence (thinness + overweight + obesity) of 38.0%. The distribution differed by sex (Figure 1): women showed both more thinness (28.6% vs 25.0% in men) and more overweight/obesity (20.4% vs 6.2% in men), reflecting a more marked double nutritional burden among female students; this difference in distribution between sexes was borderline statistically significant (χ² = 7.43; df = 3; P = 0.059). Table 2 is really more interesting for what it hides behind the averages than for the averages themselves. Mean BMI looked unremarkable on paper, and barely different between men and women, yet individual values ranged from 13.7 kg/m² to 38.7 kg/m², everything from severe thinness to class II obesity, sitting side by side in the same dataset. Weight, height and MUAC told the same story: close on average across sexes, but pulling apart the moment students are split into WHO categories. Averages, in other words, would have hidden the double burden completely; it only shows up once you look at the breakdown, which is really the point of Table 2 and Figure 1.
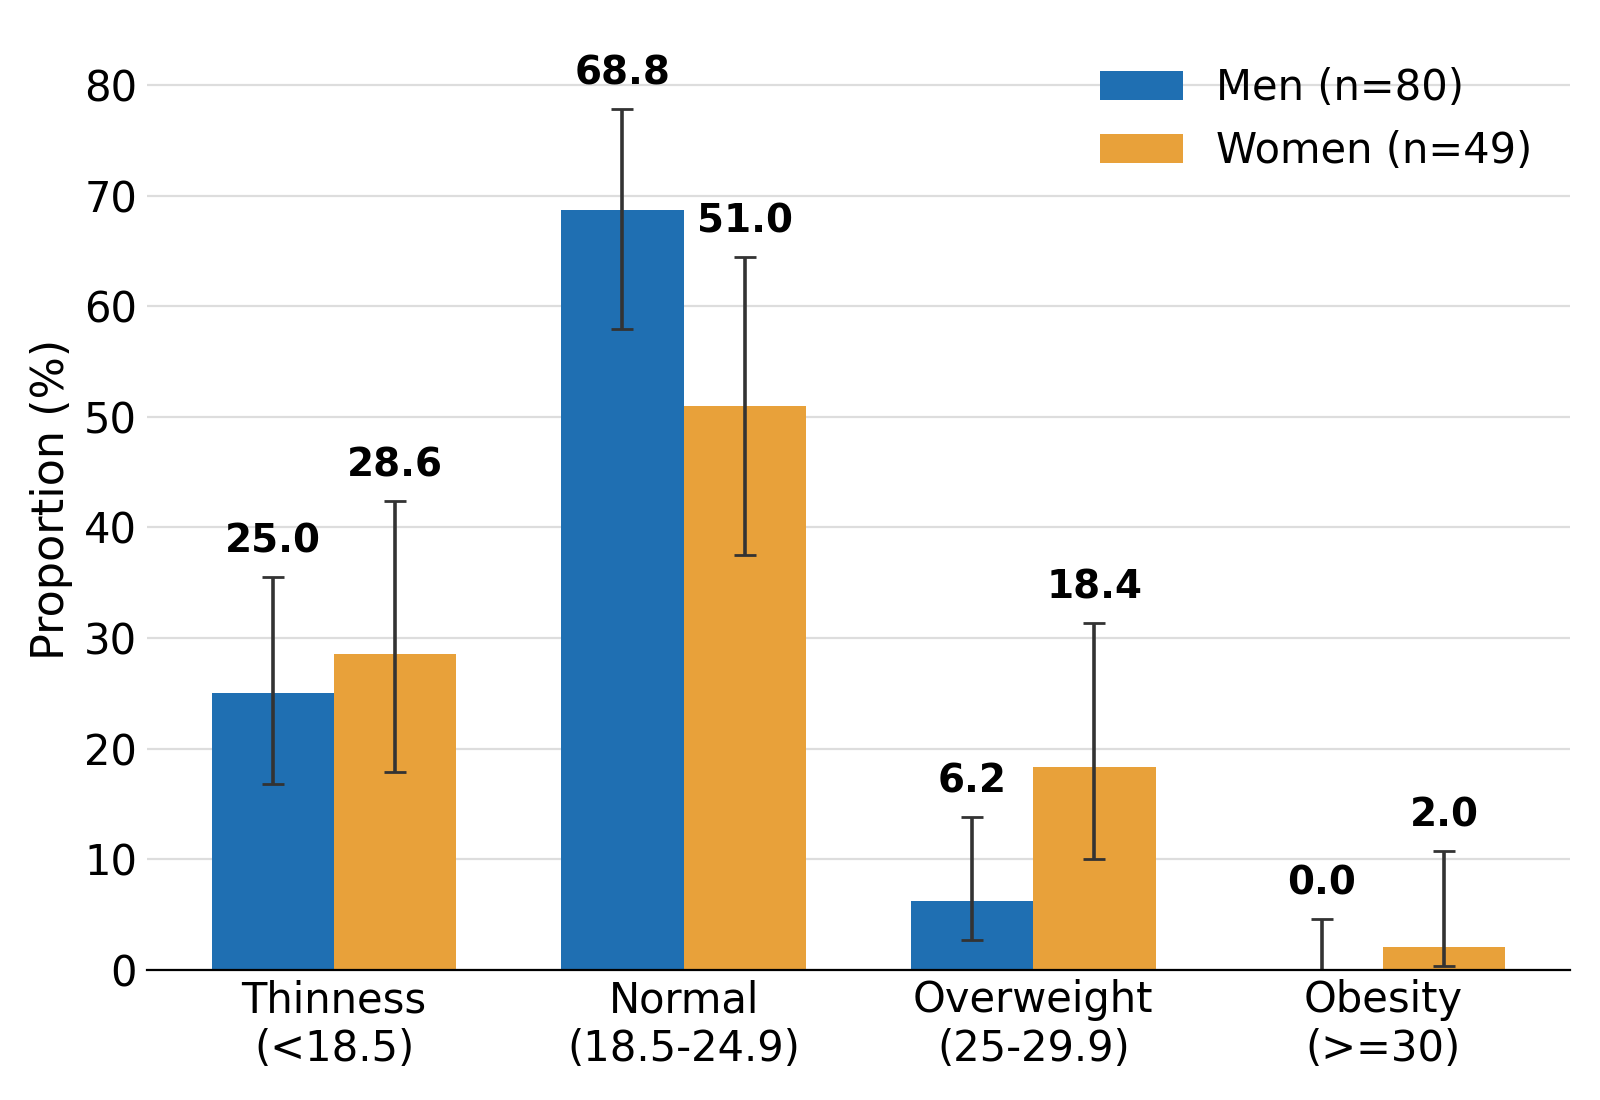
Percentage distribution of students by nutritional status, assessed by body mass index (BMI, World Health Organization [WHO] criteria), shown separately for men (n = 80) and women (n = 49). Error bars represent 95% confidence intervals (95% CI) for each proportion, calculated using the Wilson score method. BMI: body mass index; WHO: World Health Organization.
This table compares anthropometric characteristics and nutritional status between men and women. Continuous variables are expressed as mean ± standard deviation (SD) and compared using Student's t-test; categorical variables are expressed as number and percentage n (%), with 95% confidence intervals (95% CI, Wilson score method) in square brackets, and compared using Pearson's chi-square test. SD: standard deviation; BMI: body mass index; MUAC: mid-upper arm circumference; P: statistical significance. * Overall P-value of the Chi-square test across 4 categories (nutritional status × sex), df = 3.
| Parameter | Overall (N=129) | Men (n=80) | Women (n=49) | P |
|---|---|---|---|---|
| Weight (kg), mean ± SD | 59.3 ± 10.0 | 61.0 ± 8.7 | 56.6 ± 11.3 | 0.024 |
| Height (m), mean ± SD | 1.69 ± 0.08 | 1.73 ± 0.06 | 1.62 ± 0.07 | <0.001 |
| BMI (kg/m²), mean ± SD | 20.8 ± 3.5 | 20.3 ± 2.5 | 21.5 ± 4.6 | 0.104 |
| MUAC (cm), mean ± SD | 26.2 ± 2.9 | 26.5 ± 2.5 | 25.6 ± 3.6 | 0.110 |
| Thinness, n (%) | 34 (26.4) [95% CI 19.5-34.6] | 20 (25.0) [95% CI 16.8-35.5] | 14 (28.6) [95% CI 17.8-42.4] | 0.059* |
| Normal weight, n (%) | 80 (62.0) [95% CI 53.4-69.9] | 55 (68.8) [95% CI 57.9-77.8] | 25 (51.0) [95% CI 37.5-64.4] | 0.059* |
| Overweight, n (%) | 14 (10.9) [95% CI 6.6-17.4] | 5 (6.2) [95% CI 2.7-13.8] | 9 (18.4) [95% CI 10.0-31.4] | 0.059* |
| Obesity, n (%) | 1 (0.8) [95% CI 0.1-4.3] | 0 (0.0) [95% CI 0.0-4.6] | 1 (2.0) [95% CI 0.4-10.7] | 0.059* |
3.3. Lifestyle and Dietary Habits
Physical activity was reported by 115 students (89.1%), described as regular by 57 of them (44.2%), irregular by 41 (31.8%) and occasional by 17 (13.2%); 14 students (10.9%) reported no physical activity at all. Alcohol consumption concerned 11 students (8.5%) and tobacco use 9 students (7.0%), while tea or coffee consumption concerned the majority of the sample (74.4%). Regarding meal patterns, 1 student (0.8%) ate only one meal per day, 89 (69.0%) ate two, 35 (27.1%) ate three, and 4 (3.1%) ate four or more. Breakfast was skipped by 74 students, i.e. 57.4% of the sample. Analysis of consumption frequency by food group (Figure 2) revealed a diet dominated by starchy staples, with daily consumption of cereals and starches in 93.8% of students, fats in 85.3%, and vegetables in 84.5%. Conversely, daily consumption of micronutrient-dense food groups remained low: fruit (36.4%), pulses (13.2%) and milk/dairy products (10.1%). Daily consumption of sugary products (41.1%) and, to a lesser extent, carbonated drinks (6.2%) was also noted. Figure 2 makes the imbalance easy to see at a glance, indeed the food groups students eat daily cluster almost entirely among the starchy, energy-dense options, cereals, fats and vegetables, while fruit, pulses and dairy barely register. That pattern is worth reading alongside the meal habits described above. Skipping breakfast in more than half the sample, and eating only two meals a day for seven in ten students, does not leave much room to fit in the food groups already in short supply; when a student's day narrows to two meals, whatever is quickest and most filling, rice, bread, oil, tends to win out over fruit or dairy, which read more as extras here than as staples. Physical activity, for its part, was reported by the large majority of students (89.1%), though only 44.2% described it as regular, so the picture on the exercise side looks somewhat more reassuring than the one on diet.
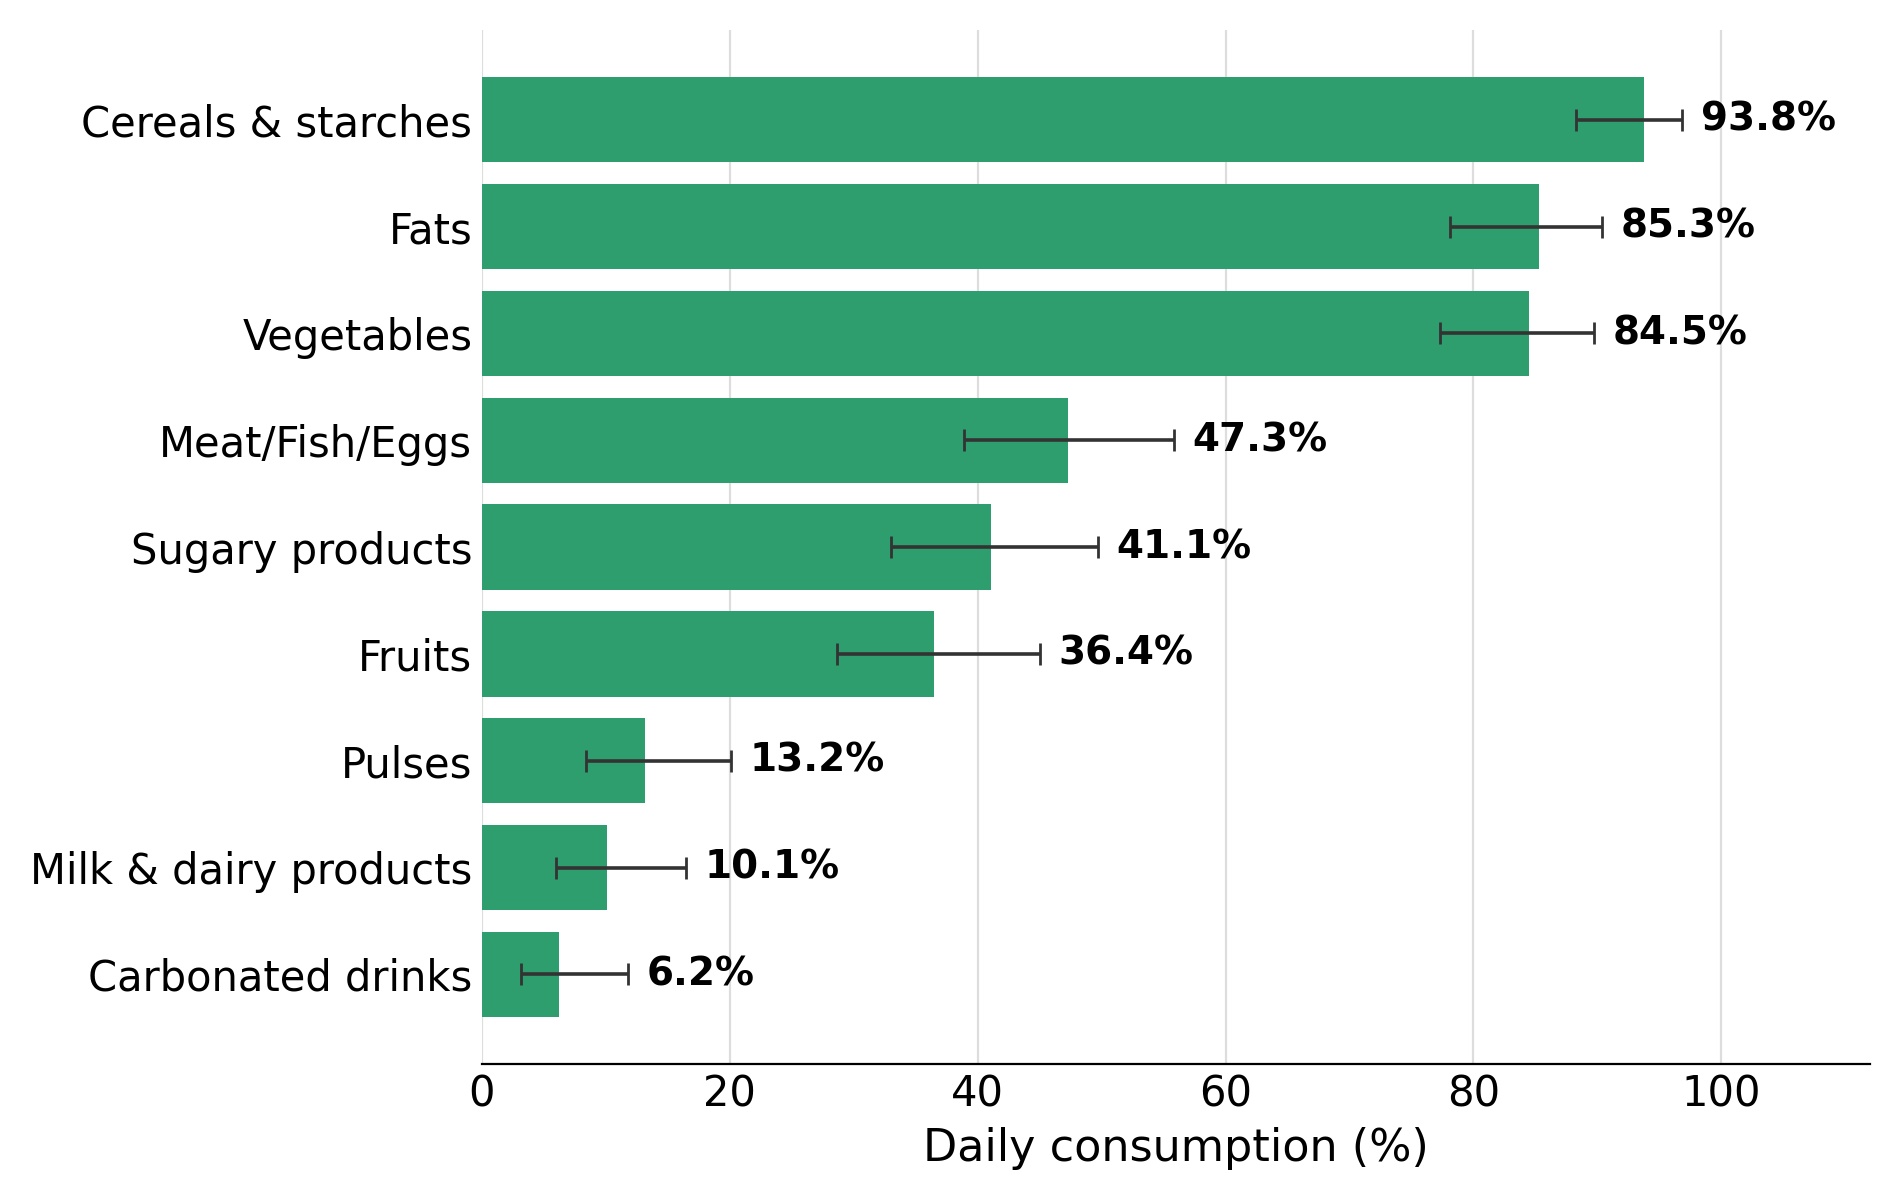
Proportion of students (N = 129) reporting daily consumption of each food group, assessed from a food-frequency questionnaire. Food groups are ranked in descending order of daily consumption frequency. Error bars represent 95% confidence intervals (95% CI) for each proportion, calculated using the Wilson score method.
3.4. Clinical and Biological Parameters
Mean systolic blood pressure was 115.0 ± 12.8 mmHg and mean diastolic pressure was 73.3 ± 8.8 mmHg (n = 127, two non-usable values excluded) (Table 3). Hypertension was found in 17 students (13.4%) and hypotension in 3 (2.4%), with 107 students (84.3%) having normal blood pressure readings. Mean capillary glycaemia was 0.91 ± 0.10 g/L (n = 127, one outlier and one missing value excluded); it was normal in 122 students (96.1%), with 3 cases of hyperglycaemia (2.4%) and 2 cases of hypoglycaemia (1.6%). Mean haemoglobin level was 13.2 ± 2.7 g/dL. Using sex-specific WHO thresholds, anaemia was observed in 37 students, an overall prevalence of 28.7%. This prevalence was higher among women (18/49, 36.7%) than men (19/80, 23.8%), although the difference did not reach statistical significance (χ² = 1.91; P = 0.167). Table 3 brings these three clinical and biological domains together, and what stands out is less any single abnormal value than how often findings clustered near normal on average while still leaving a meaningful minority outside it. Blood pressure and glycaemia were both essentially normal for the great majority of students, with hypertension, hypotension, hyperglycaemia and hypoglycaemia each affecting only a handful of participants, generally well under one in ten. Anaemia broke that pattern: nearly three in ten students were affected, rising to closer to one in three among women, a scale of difference that puts anaemia in a different category from the other parameters, less an isolated finding than a burden layered on top of the nutritional-status picture already described in section 3.2.
This table presents the students' clinical (blood pressure) and biological (capillary glycaemia, haemoglobin) parameters, together with the prevalence of associated abnormalities. Continuous variables are expressed as mean ± SD; categorical variables are expressed as number and percentage n (%), with 95% CI (Wilson score method) in square brackets. n: number of participants with valid data for the variable concerned; two biologically implausible values (one blood pressure reading and one glycaemia reading) were excluded and treated as missing (see Section 2.5).
| Parameter | n analysed | Result |
|---|---|---|
| Systolic blood pressure (mmHg), mean ± SD | 127 | 115.0 ± 12.8 |
| Diastolic blood pressure (mmHg), mean ± SD | 127 | 73.3 ± 8.8 |
| Hypertension, n (%) | 127 | 17 (13.4) [95% CI 8.5-20.4] |
| Hypotension, n (%) | 127 | 3 (2.4) [95% CI 0.8-6.7] |
| Capillary glycaemia (g/L), mean ± SD | 127 | 0.91 ± 0.10 |
| Hyperglycaemia (> 1.10 g/L), n (%) | 127 | 3 (2.4) [95% CI 0.8-6.7] |
| Hypoglycaemia (< 0.70 g/L), n (%) | 127 | 2 (1.6) [95% CI 0.4-5.6] |
| Haemoglobin (g/dL), mean ± SD | 129 | 13.2 ± 2.7 |
| Anaemia (WHO, sex-specific thresholds), n (%) | 129 | 37 (28.7) [95% CI 21.6-37.0] |
| — of whom, women with anaemia, n (%) | 49 | 18 (36.7) [95% CI 24.7-50.7] |
| — of whom, men with anaemia, n (%) | 80 | 19 (23.8) [95% CI 15.8-34.1] |
3.5. Factors Associated with Nutritional Status
Table 4 summarises the bivariate analyses exploring socio-demographic and behavioural factors associated with nutritional status (BMI). Sex was the factor closest to the significance threshold (P = 0.059). No statistically significant association was found between nutritional status and age, breakfast consumption, physical activity, type of accommodation, year of study, or number of daily meals. Likewise, nutritional status was not significantly associated with anaemia status (χ² = 1.25; P = 0.741), nor was breakfast consumption significantly associated with anaemia status (χ² = 0.00; P = 1.000). None of the associations was statistically significant at the conventional level but the sex difference was close (P = 0.059) and deserves to be revisited in conjunction with Table 2, which indicates that women have higher rates of both thinness and overweight or obesity than men. With only 129 students, spread across three or four groups for each variable, even a meaningful difference may not achieve statistical significance simply because of low power; not finding an effect does not mean there isn’t one. In a multivariable logistic regression model adjusting for age, breakfast consumption, physical activity, type of accommodation and year of study, female sex remained associated with higher odds of malnutrition (aOR = 2.50, 95% CI: 1.04-6.02; P = 0.041); physical activity showed a similar upward trend that did not reach significance after adjustment (aOR = 3.86, 95% CI: 0.86-17.24; P = 0.077). The overall model did not significantly exceed the null model (likelihood-ratio P = 0.255; pseudo-R² = 0.06), so the adjusted estimates should be interpreted as a small, hypothesis-generating improvement of the bivariate results, not as a conclusive result given the sample size. It is also interesting that nutritional status did not correlate significantly with anaemia (Table 4) in spite of the high prevalence of both problems in this group. It implies that the two conditions are not closely associated in this population but that there are several different factors that contribute to students’ nutritional health.
This table summarises the bivariate analyses exploring the association between nutritional status (BMI) and various socio-demographic and behavioural factors. df: degree(s) of freedom; r: Pearson correlation coefficient. Statistical significance threshold: P < 0.05.
| Factor | Statistical test | Value | P |
|---|---|---|---|
| Sex | Chi² (df=3) | 7.43 | 0.059 |
| Age (correlation with BMI) | Pearson r | -0.10 | 0.283 |
| Breakfast consumption | Chi² (df=3) | 2.21 | 0.531 |
| Physical activity (active/inactive) | Chi² (df=3) | 2.66 | 0.446 |
| Type of accommodation | Chi² (df=6) | 5.11 | 0.529 |
| Year of study (1/2/3) | Chi² (df=6) | 5.08 | 0.534 |
| Number of meals/day (correlation) | Pearson r | 0.02 | 0.852 |
| Nutritional status × anaemia | Chi² (df=3) | 1.25 | 0.741 |
4. Discussion
Among the 129 students we surveyed at the FST, University of Labé, 38.0% showed some form of malnutrition, including 26.4% thin and 11.7% carrying excess weight. Seeing both ends of the spectrum in the same student population is not unusual; it fits the double nutritional burden already documented on other African campuses [1,2,4]. Our overall figure sits close to the 29.4% reported by Fala Bede et al. among medical students at three Cameroonian universities [2], but the balance within that figure looks different: their sample leaned more toward overweight and obesity (24.6% combined, against just 4.9% thinness), whereas ours leans the other way. Part of the explanation may lie in Labé's specific socio-economic context. The same region already stood out for a high burden of undernutrition among older adults, nearly double the national average [6], which hints at a vulnerability that is not confined to any one age group. The double burden was more pronounced among women in our sample, who combined higher rates of both thinness and overweight/obesity than their male classmates. This mirrors a pattern often described in the African literature, where women in the same populations tend to be exposed to both ends of the malnutrition spectrum simultaneously [1]. The sex difference we observed only reached a statistical trend (P = 0.059) rather than significance in the unadjusted comparison, plausibly a question of sample size rather than a true absence of effect. Reassuringly, after adjusting for age, breakfast consumption, physical activity, type of accommodation and year of study in a multivariable logistic regression model, the association between female sex and malnutrition strengthened to conventional significance (aOR = 2.50, 95% CI: 1.04-6.02; P = 0.041), reinforcing rather than overturning this pattern, even though the overall model itself was not a significant improvement over the null (P = 0.255) and the finding should still be confirmed in larger samples. One of our more reassuring findings was the strong correlation between MUAC and BMI (r = 0.77; P < 0.001), which lines up with correlations of similar strength (0.56 to 0.68) reported elsewhere in African and Asian adult populations [9,10]. This is of practical importance: MUAC is a rapid, inexpensive and scale- or stadiometer-free screening approach, making it a feasible screening option for university health services that are not always well equipped. The documented eating patterns are very concerning. More than half of the students (57.4 per cent) skipped breakfast, and most (69.0 per cent) ate only twice a day. These two findings are very similar to the international picture: a 28-country study found 48.0% of students skipping breakfast, again associated with living away from home and eating too little fruit and vegetables [3], exactly the pattern we see here. Daily intake of fruit, pulses and dairy was low across the board (36.4%, 13.2% and 10.1% respectively), while cereals and fats were eaten by nearly everyone. That combination, heavy on starch and fat and light on micronutrients and quality protein, echoes what has been reported among coastal Kenyan students, who also ate poorly despite knowing, in principle, what a balanced diet should look like [4][11]. It's a reminder that nutrition education alone rarely changes behaviour; it needs to be paired with something more concrete, like affordable, accessible food options on campus [4]. Anaemia affected close to three in ten students (28.7%), a figure comparable to the 20.0% recorded at the start of the academic year among Ghanaian students in Cape Coast, though well below the 45.1% those same students reached by year's end, after months of deteriorating campus diets [5]. We only captured a single point in time, so we cannot say whether Guinean students follow a similar downward trajectory over the year. That question, though, seems worth answering: a longitudinal study tracking nutritional and iron status across a full academic year would tell us whether the picture here gets worse the same way it did in Ghana. Hypertension in 13.4% of a population this young (mean age 22.5) is not a trivial number. The high daily intake of fats (85.3%) and sugary foods (41.1%) that we observed is a plausible contributor, but our data cannot establish a direct statistical link. Either way, this fits a wider worrying trend: non-communicable diseases are creeping into younger age groups across the continent as the epidemiological transition speeds up [1]. No association was observed between nutritional status and breakfast habits, physical activity, year of study or type of accommodation, in the bivariate and adjusted analysis. That does not necessarily mean these factors are irrelevant: with only 129 participants, and several variables coded as simple yes/no categories, our analysis may simply have lacked the power to detect real but modest associations. One adjusted estimate deserves a cautious mention: physical activity showed an upward, non-significant trend towards higher malnutrition odds (aOR = 3.86; P = 0.077), the opposite direction from the simple protective effect often assumed. Given the small numbers in the least active subgroups and the borderline P-value, we regard this as hypothesis-generating rather than conclusive, and would caution against over-interpreting it without replication in a larger sample.
4.1. Limitations
-
The cross-sectional design cannot establish causality between dietary habits and the nutritional status we observed.
-
Recruitment was limited to one faculty (FST) at one university, so these findings may not generalise to other Guinean students, or even to the rest of the University of Labé.
-
Dietary intake was self-reported via a consumption-frequency questionnaire, which is prone to recall and social-desirability bias and does not capture precise energy or nutrient quantities.
-
Nutritional status was assessed only through indirect markers, namely BMI, MUAC, blood pressure, capillary glycaemia and haemoglobin, with no protein or lipid work-up available to gauge cardiometabolic risk more directly.
-
With only 129 participants, statistical power for detecting associated factors was limited, particularly for the sex comparison, which fell just short of significance; the sex ratio we ultimately achieved in the field (80 men/49 women) also drifted somewhat from the sampling design's target (87 men/42 women).
5. Conclusion
Undergraduate students at the FST, University of Labé, carry a double nutritional burden: 26.4% are thin and 11.7% overweight or obese, alongside a notable prevalence of anaemia (28.7%) and hypertension (13.4%). Behind these numbers sit some clearly identifiable habits: frequent breakfast-skipping, too few meals, and not enough fruit, pulses or dairy in the daily diet. A few practical steps follow from these findings: (a) Nutrition education within Guinean universities should specifically target breakfast, dietary diversity, and the consumption of fruit, pulses and dairy products; (b) University catering needs to be both affordable and nutritionally balanced, especially for students renting accommodation or living in dormitories, who may face tighter budgets; (c) University health services should screen routinely for anaemia and hypertension, with a clear pathway to treatment when needed; (d) Future research should move beyond a single faculty and a single time point; multicentre, longitudinal studies with fuller biological work-ups (protein and lipid profiles) and more precise dietary intake data would help clarify what really drives students' nutritional status, and whether targeted interventions can shift it.
Declarations
Ethics approval and consent to participate
Data Collection Authorisation No. 008/UL/FST/VD-R/2026, dated 30 May 2026. The study was conducted in accordance with the principles of the Declaration of Helsinki. Written/verbal informed consent was obtained from all participants prior to enrolment; participation was voluntary, and data were handled anonymously and confidentially.
Consent for publication
Not applicable (no identifiable individual data or images are presented).
Conflict of interest
The authors declare no conflict of interest in relation to this article.
Data availability
Anonymised individual-level data supporting the findings of this study are provided as supplementary material (Supplementary Data S1), together with the Python analysis script used to compute every statistic and model reported in the manuscript (Supplementary data S2).
Funding
This study did not receive any specific external research funding. Mamadou Oury Diallo, Lanan Wassy Soromou, Abdoulaye Oury Barry and Eric Ghigo are employed by the Ministry of Higher Education and Scientific Research (MESRS).
Author contributions
Mamadou Oury Diallo: conceptualisation, data collection, formal analysis, writing – original draft. Lanan Wassy Soromou and Abdoulaye Oury Barry: data analysis and interpretation, writing – review and editing. Eric Ghigo: supervision, conceptualisation, writing – review and editing, corresponding author. All authors read and approved the final manuscript.
Use of Artificial Intelligence (AI) tools
During the preparation of this manuscript, the authors used an AI-based large language model assistant (Claude, Anthropic) to assist with statistical data analysis and English-language editing. All AI-assisted output was reviewed, verified against the source dataset, and edited by the authors, who take full responsibility for the accuracy, integrity and scientific content of the final manuscript. No AI tool is credited as an author.
Acknowledgements
The authors thank the students of the FST, University of Labé, who agreed to take part in this study, as well as the faculty's academic and administrative staff.
References
- Gouda HN, Charlson F, Sorsdahl K, Ahmadzada S, Ferrari AJ, Erskine H, et al. Burden of non-communicable diseases in sub-Saharan Africa, 1990-2017: results from the Global Burden of Disease Study 2017. Lancet Glob Health. 2019;7(10):e1375-e1387. DOI ↗ Google Scholar ↗
- Fala Bede, Cumber SN, Nkfusai CN, Venyuy MA, Ijang YP, Wepngong EN, et al. Dietary habits and nutritional status of medical school students: the case of three state universities in Cameroon. Pan Afr Med J. 2020;35:15. DOI ↗ Google Scholar ↗
- Pengpid S, Peltzer K. Prevalence and associated factors of skipping breakfast among university students from 28 countries: a cross-sectional study. Int J Adolesc Med Health. 2022;34(2):97-103. DOI ↗ Google Scholar ↗
- Mogeni BK, Ouma LO. Dietary patterns, behaviours, and their associated factors among university students in coastal Kenya. Cogent Food Agric. 2022;8(1):2132873. DOI ↗ Google Scholar ↗
- Amoaning RE, Amoako ES, Kyiire GA, Owusu DD, Bruce H, Simpong DL, et al. Anaemia prevalence more than doubles in an academic year in a cohort of tertiary students: a repeated-measure study in Cape Coast, Ghana. Adv Hematol. 2022;2022:4005208. DOI ↗ Google Scholar ↗
- Millimono TM, Camara A, Mabiama G, Daffé M, Boumediene F, Preux PM, et al. État nutritionnel des personnes âgées en Guinée : 1re étude transversale nationale représentative. Nutr Clin Métab. 2022;36(Suppl 1):S73. DOI ↗ Google Scholar ↗
- World Health Organization. Obesity: preventing and managing the global epidemic. Report of a WHO Consultation. WHO Technical Report Series No. 894. Geneva: WHO; 2000. Google Scholar ↗
- World Health Organization. Haemoglobin concentrations for the diagnosis of anaemia and assessment of severity. Vitamin and Mineral Nutrition Information System (VMNIS). Geneva: WHO; 2011. DOI ↗ Google Scholar ↗
- Musa IR, Omar SM, Adam I. Mid-upper arm circumference as a substitute for body mass index in the assessment of nutritional status among adults in eastern Sudan. BMC Public Health. 2022;22(1):2056. DOI ↗ Google Scholar ↗
- Negi S, Srinath N, Akshay M. Comparing mid-upper arm circumference with body mass index for assessing nutritional status in Indian adults: evidence from the National Family Health Survey 2015-16 (NFHS-4). Cureus. 2024;16(5):e59629. DOI ↗ Google Scholar ↗
- Nyanchoka MA, van Stuijvenberg ME, Tambe AB, Zuma MK, Mbhenyane XG. Fruit and vegetable consumption patterns and risk of chronic diseases of lifestyle among university students in Kenya. Int J Environ Res Public Health. 2022;19(12):6965. DOI ↗ Google Scholar ↗
- Institut National de la Statistique (INS), ICF. Enquête Démographique et de Santé en Guinée 2018. Conakry, Guinée et Rockville, Maryland, USA: INS et ICF; 2019. Google Scholar ↗
Appendix
Supplementary Material Legend
Dietary Habits and Nutritional Status of Undergraduate Students at the University of Labé, Republic of Guinea: A Descriptive and Analytical Cross-Sectional Study
Supplementary data S1
This file holds the de-identified dataset behind the results in the manuscript: one record per participant, 129 in total. The data come from a structured questionnaire together with direct anthropometric and clinical measurements, collected between 1 June and 31 July 2026 from undergraduate students (Years 1-3) at the Faculty of Science and Technology (FST), University of Labé, Republic of Guinea. Participants were recruited by stratified systematic random sampling by sex, with a 1/10 sampling fraction. The Vice-Dean for Research at FST authorised the data collection (Authorisation Note No. 008/UL/FST/VD-R/2026, dated 30 May 2026); participation was voluntary, and every student gave informed consent beforehand. Data were anonymised at the point of collection, so nothing in this file can identify a participant.
The file is a Microsoft Excel workbook (.xlsx) with three sheets:
ReadMe — a short overview of the study, how the data were collected, the ethical approval, and a few notes on missing values and how the confidence intervals were calculated.
Raw_Data — the dataset itself, one row per participant (Participant_ID 1 to 129) and 39 columns, spanning socio-demographics, anthropometric measurements and nutritional status, lifestyle and dietary habits (including how often each of nine food groups was eaten), and clinical/biological parameters (blood pressure, capillary glycaemia, haemoglobin, anaemia status).
Codebook — a variable-by-variable guide to the Raw_Data sheet, explaining what each column means and its unit or coding.
A blank cell means the value is missing. Two readings were dropped from the analysis because they were biologically implausible — one blood pressure measurement and one glycaemia measurement (see Section 2.5 of the manuscript) — and those cells are left blank rather than filled with a placeholder. We did not assay albumin, total cholesterol or triglycerides in this study, so they simply do not appear in the file. The 95% confidence intervals reported in Tables 1-3 of the manuscript were calculated from this same dataset, using the Wilson score method for binomial proportions.
Supplementary data S2
Supplementary data S2 is provided to allow independent verification and re-execution of every statistic reported in the manuscript directly from Raw_Data sheet: descriptive statistics (Tables 1-3), Wilson score 95% confidence intervals, bivariate tests (Welch's t-test, Pearson's chi-square test, Pearson correlation) underlying Table 4, and the multivariable logistic regression model referenced in Sections 2.5, 3.5 and 4. The script requires Python 3.9+ with pandas, numpy, scipy, statsmodels and openpyxl.
Supplementary Data S1: Anonymised Raw Data
International Journal of Scientific Research and Management (IJSRM)
Dietary Habits and Nutritional Status of Undergraduate Students at the University of Labé, Republic of Guinea: A Descriptive and Analytical Cross-Sectional Study
Description
This file contains the de-identified, participant-level dataset (N = 129) underlying the results reported in the manuscript. Data were collected by structured questionnaire and direct anthropometric/clinical measurement, between 1 June and 31 July 2026, from undergraduate students (Years 1–3) at the Faculty of Science and Technology (FST), University of Labé, Republic of Guinea, following stratified systematic random sampling by sex (1/10 sampling fraction). Data collection was authorised by the Vice-Dean for Research, FST, University of Labé (Authorisation Note No. 008/UL/FST/VD-R/2026, dated 30 May 2026). Participation was voluntary and preceded by informed consent; data were anonymised at collection.
Contents
Part A – Raw data: one row per participant (Participant_ID), all variables analysed in the manuscript. For legibility, the 39 variables are presented in four column blocks (A1–A4); Participant_ID is repeated in each block.
Part B – Codebook: description, unit and/or coding of every variable.
The same data are provided in machine-readable form in IJSRM_Supplementary_Raw_Data06102026.xlsx.
Notes
Blank cells denote missing data (see manuscript Section 2.5 for the two data points excluded as biologically implausible: one blood pressure reading and one glycaemia reading).
Albumin, total cholesterol and triglycerides were not assayed in this study and are not included.
95% confidence intervals reported in the manuscript tables were calculated from these data using the Wilson score method for binomial proportions.
Physical_activity_yn is derived from Physical_activity_frequency (No when frequency = None, Yes otherwise) for consistency with the manuscript; the raw yes/no questionnaire item disagreed with the frequency item for 4 participants.
Part A – Raw data (N = 129)
Block A1 of 4 – variables: Sex to Height_m
| Participant_ID | Sex | Age_years | Marital_status | Year_of_study | Accommodation | Faculty_department | Income_source | Perceived_living_conditions | Weight_kg | Height_m |
|---|---|---|---|---|---|---|---|---|---|---|
| 1 | Female | 20 | Single | L1 | Rented | FST | Parents and guardian | Acceptable | 73 | 1.59 |
| 2 | Male | 24 | Single | L1 | Rented | FST | Parents and maintenance grant | Average | 74 | 1.83 |
| 3 | Male | 25 | Single | L1 | University dormitory | FST | Parents and maintenance grant | Average | 74 | 1.84 |
| 4 | Male | 23 | Single | L1 | Rented | FST | Parents and maintenance grant | Good | 63 | 1.77 |
| 5 | Female | 21 | Single | L1 | Rented | FST | Personal income and grant | Acceptable | 61 | 1.62 |
| 7 | Female | 20 | Single | L2 | Family home | FST | Parents and maintenance grant | Acceptable | 71 | 1.69 |
| 8 | Female | 21 | Married | L2 | Family home | FST | Parents and maintenance grant | Average | 76 | 1.64 |
| 9 | Male | 24 | Single | L1 | Family home | FST | Parents and maintenance grant | Average | 54 | 1.63 |
| 10 | Female | 24 | Single | L1 | Family home | FST | Parents and maintenance grant | Average | 60 | 1.68 |
| 11 | Male | 22 | Single | L1 | Rented | FST | Parents and maintenance grant | Average | 53 | 1.68 |
| 12 | Female | 22 | Single | L1 | Rented | FST | Parents and maintenance grant | Average | 71 | 1.65 |
| 16 | Female | 21 | Single | L1 | Rented | FST | Parents and maintenance grant | Average | 66 | 1.69 |
| 17 | Male | 23 | Single | L1 | Rented | FST | Parents and maintenance grant | Precarious | 69 | 1.73 |
| 18 | Male | 23 | Single | L1 | Rented | FST | Parents and maintenance grant | Acceptable | 63 | 1.77 |
| 19 | Male | 20 | Single | L1 | Rented | FST | Parents and personal income | Average | 57 | 1.82 |
| 22 | Male | 22 | Single | L1 | University dormitory | FST | Parents and maintenance grant | Precarious | 63 | 1.76 |
| 23 | Female | 20 | Single | L1 | Family home | FST | Parents and maintenance grant | Good | 41 | 1.67 |
| 24 | Female | 20 | Single | L1 | Family home | FST | Parents and maintenance grant | Good | 87 | 1.50 |
| 25 | Female | 22 | Single | L1 | University dormitory | FST | Parents and maintenance grant | Acceptable | 49 | 1.54 |
| 26 | Male | 26 | Single | L1 | Rented | FST | Parents and maintenance grant | Acceptable | 65 | 1.73 |
| 27 | Female | 19 | Single | L1 | Family home | FST | Parents and maintenance grant | Acceptable | 44 | 1.61 |
| 28 | Female | 22 | Single | L1 | Rented | FST | Parents and maintenance grant | Good | 55 | 1.77 |
| 29 | Female | 20 | Single | L1 | Rented | FST | Parents and maintenance grant | Acceptable | 58 | 1.59 |
| 30 | Male | 20 | Single | L1 | Family home | FST | Personal income and grant | Average | 50 | 1.72 |
| 31 | Male | 23 | Single | L1 | Family home | FST | Parents and maintenance grant | Acceptable | 82 | 1.74 |
| 32 | Male | 23 | Single | L1 | Family home | FST | Parents and maintenance grant | Acceptable | 60 | 1.70 |
| 33 | Male | 22 | Single | L1 | Family home | FST | Parents and maintenance grant | Acceptable | 59 | 1.76 |
| 34 | Male | 20 | Single | L1 | Rented | FST | Parents and maintenance grant | Acceptable | 50 | 1.74 |
| 35 | Male | 25 | Single | L1 | Rented | FST | Personal income and grant | Precarious | 57 | 1.74 |
| 36 | Male | 24 | Single | L1 | University dormitory | FST | Personal income and grant | Average | 67 | 1.79 |
| 37 | Male | 24 | Single | L1 | Rented | FST | Parents and maintenance grant | Average | 43 | 1.69 |
| 38 | Male | 21 | Single | L1 | Family home | FST | Parents and maintenance grant | Average | 61 | 1.75 |
| 39 | Female | 19 | Single | L1 | Family home | FST | Parents and maintenance grant | Acceptable | 69 | 1.73 |
| 40 | Male | 22 | Single | L1 | Family home | FST | Parents and maintenance grant | Average | 85 | 1.81 |
| 41 | Male | 21 | Single | L1 | Rented | FST | Personal income and grant | Acceptable | 57 | 1.71 |
| 42 | Male | 27 | Single | L1 | University dormitory | FST | Parents and maintenance grant | Precarious | 65 | 1.77 |
| 43 | Male | 23 | Single | L1 | Rented | FST | Parents and maintenance grant | Acceptable | 60 | 1.72 |
| 44 | Male | 25 | Single | L1 | Rented | FST | Parents and maintenance grant | Acceptable | 56 | 1.66 |
| 45 | Male | 26 | Single | L1 | Family home | FST | Parents and maintenance grant | Average | 82 | 1.82 |
| 48 | Male | 26 | Single | L1 | Rented | FST | Parents and maintenance grant | Average | 62 | 1.70 |
| 49 | Male | 19 | Single | L1 | Rented | FST | Parents and maintenance grant | Average | 64 | 1.65 |
| 50 | Male | 24 | Single | L1 | University dormitory | FST | Parents and maintenance grant | Acceptable | 59 | 1.75 |
| 53 | Male | 22 | Single | L1 | Rented | FST | Parents and maintenance grant | Average | 52 | 1.72 |
| 55 | Male | 25 | Divorced | L1 | Rented | FST | Parents and maintenance grant | Average | 57 | 1.66 |
| 56 | Male | 24 | Single | L1 | University dormitory | FST | Parents and maintenance grant | Average | 62 | 1.73 |
| 57 | Male | 23 | Single | L1 | Family home | FST | Parents and maintenance grant | Average | 55 | 1.69 |
| 58 | Female | 20 | Single | L1 | Family home | FST | Parents and maintenance grant | Average | 60 | 1.67 |
| 59 | Female | 21 | Single | L1 | Rented | FST | Parents and maintenance grant | Acceptable | 58 | 1.51 |
| 60 | Female | 21 | Single | L1 | University dormitory | FST | Parents and maintenance grant | Acceptable | 63 | 1.55 |
| 61 | Male | 23 | Single | L1 | Rented | FST | Parents and maintenance grant | Average | 48 | 1.63 |
| 62 | Male | 18 | Single | L1 | Family home | FST | Parents and maintenance grant | Good | 66 | 1.81 |
| 63 | Female | 21 | Single | L1 | Rented | FST | Parents and maintenance grant | Acceptable | 36 | 1.62 |
| 64 | Male | 23 | Single | L1 | Rented | FST | Personal income and grant | Average | 59 | 1.73 |
| 65 | Female | 19 | Single | L1 | Rented | FST | Parents and maintenance grant | Average | 46 | 1.53 |
| 66 | Female | 20 | Single | L2 | Family home | FST | Parents and maintenance grant | Precarious | 43 | 1.57 |
| 69 | Female | 22 | Single | L3 | Rented | FST | Parents and maintenance grant | Acceptable | 53 | 1.66 |
| 71 | Female | 23 | Single | L3 | Family home | FST | Parents and maintenance grant | Average | 62 | 1.57 |
| 74 | Female | 24 | Married | L3 | Family home | FST | Parents and maintenance grant | Good | 66 | 1.56 |
| 76 | Female | 24 | Single | L3 | Rented | FST | Parents and maintenance grant | Average | 52 | 1.73 |
| 79 | Male | 25 | Single | L3 | Rented | FST | Parents and maintenance grant | Precarious | 54 | 1.78 |
| 80 | Male | 21 | Single | L3 | Rented | FST | Parents and maintenance grant | Precarious | 63 | 1.80 |
| 83 | Female | 23 | Single | L3 | Family home | FST | Parents and maintenance grant | Good | 59 | 1.67 |
| 87 | Male | 22 | Single | L3 | Rented | FST | Parents and maintenance grant | Acceptable | 76 | 1.68 |
| 89 | Female | 23 | Single | L3 | Family home | FST | Parents and maintenance grant | Good | 59 | 1.67 |
| 95 | Female | 24 | Single | L3 | Rented | FST | Parents and maintenance grant | Good | 63 | 1.66 |
| 97 | Female | 23 | Single | L3 | Family home | FST | Parents and maintenance grant | Good | 42 | 1.59 |
| 107 | Female | 24 | Single | L3 | Rented | FST | Parents and maintenance grant | Average | 43 | 1.55 |
| 109 | Male | 24 | Single | L3 | Family home | FST | Parents and maintenance grant | Acceptable | 73 | 1.82 |
| 111 | Female | 23 | Single | L3 | Rented | FST | Parents and maintenance grant | Acceptable | 67 | 1.70 |
| 112 | Female | 21 | Single | L3 | Rented | FST | Parents and personal income | Average | 55 | 1.63 |
| 118 | Female | 23 | Single | L3 | Rented | FST | Parents and maintenance grant | Acceptable | 62 | 1.68 |
| 123 | Male | 21 | Single | L3 | University dormitory | FST | Parents and maintenance grant | Acceptable | 59 | 1.71 |
| 130 | Female | 24 | Married | L3 | Family home | FST | Personal income and grant | Good | 62 | 1.60 |
| 133 | Female | 23 | Single | L3 | Family home | FST | Parents and maintenance grant | Acceptable | 49 | 1.60 |
| 140 | Female | 19 | Single | L1 | University dormitory | FST | Parents and maintenance grant | Acceptable | 56 | 1.57 |
| 142 | Female | 19 | Single | L1 | Rented | FST | Parents and maintenance grant | Acceptable | 80 | 1.74 |
| 143 | Female | 23 | Single | L1 | Family home | FST | Parents and maintenance grant | Average | 42 | 1.75 |
| 144 | Male | 24 | Single | L1 | Rented | FST | Parents and maintenance grant | Average | 69 | 1.80 |
| 145 | Female | 22 | Single | L1 | Rented | FST | Parents and maintenance grant | Average | 43 | 1.54 |
| 146 | Male | 20 | Single | L1 | Rented | FST | Parents and maintenance grant | Average | 57 | 1.77 |
| 147 | Male | 20 | Single | L1 | Rented | FST | Parents and maintenance grant | Precarious | 65 | 1.86 |
| 148 | Male | 22 | Single | L1 | Rented | FST | Parents and maintenance grant | Acceptable | 63 | 1.73 |
| 149 | Female | 25 | Single | L1 | Rented | FST | Parents and maintenance grant | Average | 54 | 1.74 |
| 150 | Male | 22 | Single | L1 | Rented | FST | Parents and maintenance grant | Acceptable | 67 | 1.72 |
| 151 | Male | 23 | Single | L3 | Rented | FST | Parents and maintenance grant | Acceptable | 61 | 1.81 |
| 152 | Male | 24 | Single | L3 | University dormitory | FST | Parents and maintenance grant | Acceptable | 54 | 1.72 |
| 153 | Female | 23 | Single | L3 | University dormitory | FST | Parents and maintenance grant | Acceptable | 42 | 1.61 |
| 154 | Male | 23 | Single | L2 | Rented | FST | Parents and maintenance grant | Acceptable | 53 | 1.73 |
| 155 | Male | 22 | Single | L2 | Family home | FST | Parents and personal income | Acceptable | 74 | 1.77 |
| 156 | Male | 24 | Single | L2 | Rented | FST | Parents and maintenance grant | Acceptable | 54 | 1.71 |
| 157 | Male | 22 | Single | L2 | Rented | FST | Parents and personal income | Average | 58 | 1.71 |
| 158 | Male | 23 | Single | L2 | Rented | FST | Parents and personal income | Good | 56 | 1.74 |
| 159 | Male | 22 | Single | L1 | Rented | FST | Parents and maintenance grant | Good | 74 | 1.69 |
| 160 | Male | 23 | Single | L2 | Family home | FST | Parents and maintenance grant | Good | 51 | 1.56 |
| 161 | Male | 23 | Single | L2 | Rented | FST | Parents and personal income | Acceptable | 60 | 1.81 |
| 162 | Male | 24 | Single | L2 | Rented | FST | Parents and personal income | Acceptable | 79 | 1.78 |
| 163 | Male | 25 | Married | L2 | Family home | FST | Parents and maintenance grant | Good | 64 | 1.73 |
| 164 | Male | 25 | Single | L2 | Family home | FST | Parents and maintenance grant | Acceptable | 64 | 1.72 |
| 165 | Female | 21 | Single | L1 | Rented | FST | Parents and maintenance grant | Acceptable | 47 | 1.48 |
| 166 | Female | 21 | Married | L1 | Rented | FST | Parents and maintenance grant | Acceptable | 55 | 1.62 |
| 167 | Female | 24 | Married | L1 | Rented | FST | Parents and maintenance grant | Acceptable | 70 | 1.60 |
| 168 | Male | 25 | Single | L1 | Rented | FST | Parents and maintenance grant | Average | 55 | 1.75 |
| 169 | Male | 23 | Single | L1 | University dormitory | FST | Parents and maintenance grant | Average | 61 | 1.67 |
| 171 | Male | 22 | Single | L1 | Rented | FST | Parents and maintenance grant | Acceptable | 62 | 1.57 |
| 172 | Male | 20 | Single | L1 | Rented | FST | Parents and maintenance grant | Acceptable | 61 | 1.74 |
| 176 | Female | 24 | Single | L1 | University dormitory | FST | Parents and maintenance grant | Acceptable | 55 | 1.57 |
| 181 | Male | 22 | Married | L2 | Rented | FST | Parents and personal income | Good | 50 | 1.66 |
| 182 | Male | 22 | Single | L2 | Rented | FST | Parents and personal income | Acceptable | 53 | 1.69 |
| 183 | Male | 25 | Single | L2 | Rented | FST | Personal income and grant | Acceptable | 55 | 1.70 |
| 184 | Male | 21 | Single | L2 | Family home | FST | Parents and maintenance grant | Acceptable | 48 | 1.75 |
| 185 | Male | 27 | Married | L3 | Family home | FST | Parents and maintenance grant | Average | 64 | 1.70 |
| 186 | Male | 25 | Single | L2 | Family home | FST | Parents and maintenance grant | Average | 58 | 1.73 |
| 187 | Male | 24 | Single | L2 | Rented | FST | Personal income and grant | Acceptable | 68 | 1.79 |
| 188 | Male | 26 | Single | L2 | Rented | FST | Personal income and grant | Acceptable | 64 | 1.73 |
| 189 | Female | 22 | Single | L2 | Rented | FST | Parents and maintenance grant | Acceptable | 51 | 1.62 |
| 190 | Female | 22 | Single | L2 | Rented | FST | Parents and maintenance grant | Average | 56 | 1.62 |
| 191 | Male | 21 | Single | L2 | Rented | FST | Parents and maintenance grant | Acceptable | 64 | 1.82 |
| 192 | Male | 23 | Single | L2 | Rented | FST | Parents and personal income | Acceptable | 69 | 1.78 |
| 193 | Male | 23 | Single | L2 | Rented | FST | Parents and personal income | Average | 74 | 1.81 |
| 194 | Male | 25 | Single | L2 | Rented | FST | Parents and maintenance grant | Acceptable | 46 | 1.58 |
| 195 | Male | 23 | Single | L2 | University dormitory | FST | Parents and maintenance grant | Acceptable | 58 | 1.63 |
| 196 | Male | 21 | Single | L2 | Family home | FST | Parents and maintenance grant | Acceptable | 54 | 1.69 |
| 197 | Male | 24 | Married | L2 | Rented | FST | Parents and maintenance grant | Average | 47 | 1.61 |
| 198 | Female | 20 | Single | L1 | Rented | FST | Parents and maintenance grant | Average | 47 | 1.61 |
| 199 | Female | 25 | Married | L2 | Rented | FST | Parents and personal income | Acceptable | 42 | 1.63 |
| 200 | Female | 20 | Single | L3 | Rented | FST | Maintenance grant and personal income | Average | 54 | 1.57 |
| 201 | Male | 21 | Single | L2 | University dormitory | FST | Maintenance grant and personal income | Acceptable | 62 | 1.72 |
| 202 | Male | 24 | Single | L2 | University dormitory | FST | Parents and maintenance grant | Average | 47 | 1.66 |
| 203 | Male | 25 | Single | L2 | University dormitory | FST | Parents and maintenance grant | Average | 56 | 1.66 |
Block A2 of 4 – variables: BMI_kg_m2 to Tea_coffee_frequency
| Participant_ID | BMI_kg_m2 | BMI_category_WHO | MUAC_cm | Physical_activity_yn | Physical_activity_type | Physical_activity_frequency | Alcohol_consumption_yn | Tobacco_use_yn | Tea_coffee_consumption_yn | Tea_coffee_frequency |
|---|---|---|---|---|---|---|---|---|---|---|
| 1 | 28.87 | Overweight | 29 | Yes | Walking and gymnastics | Regular | No | No | Yes | Occasional |
| 2 | 22.9 | Normal weight | 29 | Yes | Walking and football | Irregular | Yes | No | Yes | Occasional |
| 3 | 21.85 | Normal weight | 32 | Yes | Walking and football | Irregular | Yes | No | Yes | Occasional |
| 4 | 20.1 | Normal weight | 25 | Yes | Walking | Regular | No | No | Yes | Daily |
| 5 | 23.24 | Normal weight | 27 | Yes | Walking | Occasional | No | No | Yes | Weekly |
| 7 | 24.85 | Normal weight | 33 | Yes | Walking | Occasional | No | No | No | |
| 8 | 28.25 | Overweight | 29 | Yes | Walking and football | Regular | No | No | No | |
| 9 | 20.32 | Normal weight | 23 | Yes | Walking and football | Regular | No | No | Yes | Occasional |
| 10 | 21.25 | Normal weight | 26 | Yes | Walking | Regular | No | No | Yes | Occasional |
| 11 | 18.77 | Normal weight | 26 | Yes | Walking and football | Regular | No | No | Yes | Weekly |
| 12 | 26.07 | Overweight | 30 | Yes | Walking | Irregular | No | No | Yes | Occasional |
| 16 | 23.1 | Normal weight | 28 | Yes | Walking | Regular | No | No | Yes | Occasional |
| 17 | 23.05 | Normal weight | 28 | Yes | Walking and football | Regular | No | No | Yes | Occasional |
| 18 | 20.1 | Normal weight | 29 | Yes | Jogging | Irregular | No | No | Yes | Occasional |
| 19 | 17.2 | Thinness | 24 | Yes | Walking and gymnastics | Irregular | No | No | Yes | Occasional |
| 22 | 20.33 | Normal weight | 26 | Yes | Walking and football | Regular | No | No | No | |
| 23 | 14.7 | Thinness | 22 | Yes | Walking | Regular | No | No | No | |
| 24 | 38.66 | Obesity | 37 | Yes | Walking | Regular | No | No | Yes | Occasional |
| 25 | 20.66 | Normal weight | 27 | Yes | Walking | Regular | No | No | Yes | Occasional |
| 26 | 21.71 | Normal weight | 26 | Yes | Football | Regular | No | No | Yes | Daily |
| 27 | 16.97 | Thinness | 21 | Yes | Walking | Regular | No | No | Yes | Daily |
| 28 | 17.55 | Thinness | 23 | Yes | Walking | Occasional | No | No | Yes | Daily |
| 29 | 22.99 | Normal weight | 27 | Yes | Walking and football | Occasional | No | No | Yes | Occasional |
| 30 | 16.9 | Thinness | 23 | Yes | Walking and football | Regular | No | Yes | Yes | Occasional |
| 31 | 27.08 | Overweight | 30 | Yes | Football | Regular | No | No | Yes | Occasional |
| 32 | 20.76 | Normal weight | 25 | Yes | Football | Regular | No | No | Yes | Occasional |
| 33 | 19.04 | Normal weight | 25 | Yes | Football | Regular | No | No | Yes | Occasional |
| 34 | 16.51 | Thinness | 24 | Yes | Walking and football | Irregular | No | No | No | |
| 35 | 18.82 | Normal weight | 27 | Yes | Walking and football | Irregular | No | No | Yes | Occasional |
| 36 | 20.91 | Normal weight | 26 | Yes | Walking and football | Regular | No | No | Yes | Occasional |
| 37 | 15.05 | Thinness | 25 | Yes | Walking | Regular | No | No | Yes | Weekly |
| 38 | 19.91 | Normal weight | 27 | Yes | Football | Regular | No | No | Yes | Weekly |
| 39 | 23.05 | Normal weight | 27 | Yes | Walking | Occasional | No | No | Yes | Occasional |
| 40 | 25.94 | Overweight | 30 | Yes | Gymnastics | Irregular | No | No | Yes | Weekly |
| 41 | 19.49 | Normal weight | 26 | Yes | Walking and gymnastics | Occasional | No | No | Yes | Occasional |
| 42 | 20.74 | Normal weight | 27 | Yes | Football | Irregular | No | No | No | |
| 43 | 20.28 | Normal weight | 26 | Yes | Gymnastics | Irregular | No | No | Yes | Daily |
| 44 | 20.32 | Normal weight | 26 | Yes | Walking and football | Irregular | No | No | Yes | Daily |
| 45 | 24.75 | Normal weight | 33 | Yes | Walking and football | Regular | No | No | Yes | Occasional |
| 48 | 21.45 | Normal weight | 28 | Yes | Football | Regular | No | No | No | |
| 49 | 23.5 | Normal weight | 28 | Yes | Walking and football | Regular | Yes | No | Yes | Occasional |
| 50 | 19.26 | Normal weight | 26 | Yes | Walking | Regular | Yes | No | Yes | Occasional |
| 53 | 17.57 | Thinness | 22 | Yes | Football | Regular | No | No | Yes | Occasional |
| 55 | 20.68 | Normal weight | 26 | Yes | Walking | Regular | Yes | Yes | Yes | Daily |
| 56 | 20.71 | Normal weight | 27 | Yes | Walking | Regular | Yes | No | Yes | Occasional |
| 57 | 19.25 | Normal weight | 26 | Yes | Football | Occasional | No | No | Yes | Occasional |
| 58 | 21.51 | Normal weight | 25 | Yes | Walking | Occasional | No | No | Yes | Daily |
| 59 | 25.43 | Overweight | 28 | Yes | Gymnastics | Occasional | No | No | Yes | Occasional |
| 60 | 26.22 | Overweight | 29 | Yes | Walking and football | Regular | No | No | Yes | Occasional |
| 61 | 18.06 | Thinness | 24.4 | Yes | Walking | Regular | Yes | No | Yes | Occasional |
| 62 | 20.14 | Normal weight | 25 | Yes | Gymnastics | Irregular | No | No | Yes | Occasional |
| 63 | 13.71 | Thinness | 18.0 | Yes | Jogging | Irregular | No | No | Yes | Occasional |
| 64 | 19.71 | Normal weight | 26 | Yes | Gymnastics | Regular | No | No | No | |
| 65 | 19.65 | Normal weight | 24 | Yes | Walking | Regular | No | No | No | |
| 66 | 17.44 | Thinness | 22 | Yes | Walking | Regular | No | No | No | |
| 69 | 19.23 | Normal weight | 26 | Yes | Walking | Regular | No | No | Yes | Occasional |
| 71 | 25.15 | Overweight | 24 | Yes | Walking | Regular | Yes | Yes | No | |
| 74 | 27.12 | Overweight | 31 | Yes | Walking | Regular | No | No | No | |
| 76 | 17.37 | Thinness | 23 | Yes | Walking | Occasional | No | No | Yes | Daily |
| 79 | 17.03 | Thinness | 23 | Yes | Walking and football | Irregular | No | No | Yes | Weekly |
| 80 | 19.44 | Normal weight | 27 | Yes | Walking | Regular | No | No | Yes | Weekly |
| 83 | 21.14 | Normal weight | 24 | Yes | Walking and jogging | Irregular | No | No | Yes | Occasional |
| 87 | 26.92 | Overweight | 34 | Yes | Walking and football | Irregular | No | No | Yes | Daily |
| 89 | 21.14 | Normal weight | 24 | Yes | Walking and jogging | Irregular | No | No | Yes | Occasional |
| 95 | 22.86 | Normal weight | 27 | Yes | Walking | Occasional | No | No | Yes | Daily |
| 97 | 15.82 | Thinness | 23 | Yes | Walking | Irregular | No | No | Yes | Daily |
| 107 | 17.89 | Thinness | 23 | Yes | Walking | Irregular | No | No | No | |
| 109 | 22.03 | Normal weight | 28 | Yes | Football | Regular | No | Yes | Yes | Daily |
| 111 | 23.18 | Normal weight | 29 | Yes | Walking and jogging | Occasional | No | No | Yes | Occasional |
| 112 | 20.7 | Normal weight | 26 | Yes | Walking | Irregular | No | No | Yes | Occasional |
| 118 | 21.96 | Normal weight | 27 | Yes | Walking | Irregular | No | No | Yes | Occasional |
| 123 | 20.17 | Normal weight | 29 | Yes | Walking and football | Regular | Yes | No | Yes | Occasional |
| 130 | 24.21 | Normal weight | 28 | No | No | No | Yes | Occasional | ||
| 133 | 19.44 | Normal weight | 24 | Yes | Walking | Irregular | No | No | Yes | Occasional |
| 140 | 22.71 | Normal weight | 24 | Yes | Walking | Regular | No | No | No | |
| 142 | 26.42 | Overweight | 31 | Yes | Walking | Regular | No | No | Yes | Occasional |
| 143 | 13.71 | Thinness | 22 | Yes | Walking | Occasional | No | No | Yes | Occasional |
| 144 | 21.29 | Normal weight | 28 | Yes | Walking and football | Regular | No | No | Yes | Daily |
| 145 | 18.13 | Thinness | 21 | Yes | Walking | Irregular | No | No | Yes | Occasional |
| 146 | 18.19 | Thinness | 28 | Yes | Walking and football | Regular | No | No | Yes | Occasional |
| 147 | 18.78 | Normal weight | 27 | Yes | Walking | Regular | No | Yes | Yes | Occasional |
| 148 | 21.04 | Normal weight | 27 | Yes | Walking and football | Regular | No | Yes | Yes | Daily |
| 149 | 17.83 | Thinness | 24 | No | No | No | No | |||
| 150 | 22.64 | Normal weight | 28 | Yes | Walking and football | Irregular | No | No | Yes | Daily |
| 151 | 18.61 | Normal weight | 28 | Yes | Football | Regular | No | No | No | |
| 152 | 18.25 | Thinness | 24 | Yes | Football | Regular | No | No | Yes | Occasional |
| 153 | 16.2 | Thinness | 20.0 | Yes | Walking | Regular | No | No | No | |
| 154 | 17.7 | Thinness | 22 | Yes | Walking | Irregular | No | No | Yes | Occasional |
| 155 | 23.62 | Normal weight | 28 | Yes | Walking and football | Occasional | No | Yes | Yes | Occasional |
| 156 | 18.46 | Thinness | 22 | Yes | Walking and football | Regular | No | No | Yes | Occasional |
| 157 | 19.83 | Normal weight | 25 | Yes | Walking and football | Irregular | No | No | No | |
| 158 | 18.49 | Thinness | 24 | Yes | Walking and football | Regular | No | No | Yes | Daily |
| 159 | 25.9 | Overweight | 29 | Yes | Football | Irregular | No | No | No | |
| 160 | 20.95 | Normal weight | 27 | Yes | Football | Irregular | No | No | Yes | Weekly |
| 161 | 18.31 | Thinness | 27 | Yes | Jogging | Irregular | No | No | Yes | Occasional |
| 162 | 24.93 | Normal weight | 28 | Yes | Football | Regular | No | No | Yes | Weekly |
| 163 | 21.38 | Normal weight | 25 | Yes | Football | Irregular | No | No | Yes | Weekly |
| 164 | 21.63 | Normal weight | 26 | Yes | Walking | Regular | No | No | Yes | Weekly |
| 165 | 21.45 | Normal weight | 21 | Yes | Walking | Regular | No | No | No | |
| 166 | 20.95 | Normal weight | 25 | Yes | Walking | Regular | No | No | No | |
| 167 | 27.34 | Overweight | 26 | Yes | Walking | Regular | No | No | No | |
| 168 | 17.95 | Thinness | 24 | Yes | Football | Irregular | No | No | No | |
| 169 | 21.87 | Normal weight | 27 | Yes | Football | Irregular | No | No | Yes | Daily |
| 171 | 25.15 | Overweight | 31 | Yes | Football | Occasional | No | No | Yes | Occasional |
| 172 | 20.84 | Normal weight | 26 | Yes | Football | Irregular | No | Yes | Yes | Occasional |
| 176 | 22.31 | Normal weight | 27 | Yes | Walking | Occasional | No | No | No | |
| 181 | 18.14 | Thinness | 23 | Yes | Walking and football | Irregular | No | No | Yes | Daily |
| 182 | 18.55 | Normal weight | 24 | Yes | Football | Irregular | No | No | Yes | Weekly |
| 183 | 19.03 | Normal weight | 25 | No | No | No | Yes | Daily | ||
| 184 | 15.67 | Thinness | 22 | No | No | Yes | No | |||
| 185 | 22.14 | Normal weight | 28 | Yes | Walking | Irregular | No | No | No | |
| 186 | 19.37 | Normal weight | 26 | No | No | No | Yes | Occasional | ||
| 187 | 21.22 | Normal weight | 29 | No | No | No | Yes | Weekly | ||
| 188 | 21.38 | Normal weight | 28 | No | No | No | Yes | Occasional | ||
| 189 | 19.43 | Normal weight | 26 | No | No | No | No | |||
| 190 | 19.43 | Normal weight | 27 | No | No | No | No | |||
| 191 | 19.32 | Normal weight | 28 | Yes | Football | Irregular | Yes | No | Yes | Occasional |
| 192 | 21.77 | Normal weight | 28 | No | No | No | Yes | Occasional | ||
| 193 | 22.58 | Normal weight | 30 | No | No | No | Yes | Occasional | ||
| 194 | 18.42 | Thinness | 23 | Yes | Football | Irregular | No | No | Yes | Occasional |
| 195 | 21.82 | Normal weight | 28 | No | No | No | No | |||
| 196 | 18.9 | Normal weight | 25 | Yes | Football | Irregular | No | No | No | |
| 197 | 18.13 | Thinness | 24 | No | No | No | Yes | Daily | ||
| 198 | 18.13 | Thinness | 22 | Yes | Walking | Regular | No | No | No | |
| 199 | 15.81 | Thinness | 22 | Yes | Football | Regular | No | No | Yes | Occasional |
| 200 | 21.9 | Normal weight | 24 | No | No | No | Yes | Weekly | ||
| 201 | 20.95 | Normal weight | 28 | Yes | Football | Irregular | No | No | No | |
| 202 | 17.05 | Thinness | 25 | Yes | Walking | Occasional | No | No | No | |
| 203 | 17.05 | Thinness | 28 | Yes | Football | Irregular | Yes | No | Yes | Occasional |
Block A3 of 4 – variables: Meals_per_day to Sugary_products_frequency
| Participant_ID | Meals_per_day | Breakfast_consumption_yn | Milk_dairy_frequency | Cereals_starches_frequency | Pulses_frequency | Meat_fish_eggs_frequency | Fruit_frequency | Vegetables_frequency | Fats_frequency | Sugary_products_frequency |
|---|---|---|---|---|---|---|---|---|---|---|
| 1 | 2 | No | Weekly | Daily | Weekly | Daily | Daily | Daily | Daily | Weekly |
| 2 | 2 | No | Weekly | Daily | Monthly | Weekly | Daily | Daily | Daily | Daily |
| 3 | 2 | Yes | Weekly | Daily | Weekly | Daily | Daily | Daily | Daily | Daily |
| 4 | 2 | No | Monthly | Daily | Weekly | Monthly | Daily | Weekly | Daily | Daily |
| 5 | 2 | Yes | Weekly | Daily | Daily | Weekly | Daily | Weekly | Daily | Daily |
| 7 | 2 | No | Weekly | Daily | Weekly | Daily | Daily | Daily | Daily | Weekly |
| 8 | 2 | Yes | Weekly | Daily | Weekly | Daily | Daily | Daily | Daily | Daily |
| 9 | 3 | Yes | Weekly | Daily | Weekly | Daily | Daily | Daily | Daily | Daily |
| 10 | 2 | No | Weekly | Daily | Monthly | Daily | Daily | Daily | Daily | Weekly |
| 11 | 2 | No | Weekly | Daily | Daily | Daily | Daily | Daily | Weekly | Daily |
| 12 | 3 | No | Weekly | Daily | Weekly | Daily | Weekly | Daily | Daily | Daily |
| 16 | 2 | Yes | Daily | Daily | Monthly | Daily | Weekly | Daily | Daily | Daily |
| 17 | 2 | Yes | Weekly | Daily | Monthly | Weekly | Weekly | Daily | Daily | Weekly |
| 18 | 2 | No | Weekly | Daily | Weekly | Daily | Weekly | Daily | Daily | Weekly |
| 19 | 2 | No | Monthly | Daily | Weekly | Daily | Weekly | Daily | Daily | Weekly |
| 22 | 2 | Yes | Monthly | Daily | Weekly | Monthly | Daily | Weekly | Weekly | Weekly |
| 23 | 2 | No | Weekly | Daily | Monthly | Daily | Weekly | Daily | Daily | Weekly |
| 24 | 2 | No | Monthly | Daily | Monthly | Daily | Weekly | Daily | Daily | Monthly |
| 25 | 2 | No | Monthly | Daily | Monthly | Weekly | Weekly | Daily | Daily | Monthly |
| 26 | 2 | No | Monthly | Daily | Monthly | Weekly | Weekly | Monthly | Weekly | Weekly |
| 27 | 2 | No | Weekly | Daily | Weekly | Daily | Weekly | Daily | Daily | Daily |
| 28 | 2 | No | Weekly | Daily | Weekly | Daily | Weekly | Daily | Daily | Daily |
| 29 | 2 | Yes | Weekly | Daily | Weekly | Daily | Weekly | Daily | Daily | Daily |
| 30 | 2 | No | Weekly | Daily | Weekly | Weekly | Daily | Daily | Weekly | Daily |
| 31 | 3 | Yes | Weekly | Daily | Weekly | Daily | Daily | Daily | Daily | Daily |
| 32 | 3 | Yes | Weekly | Daily | Weekly | Daily | Weekly | Daily | Daily | Daily |
| 33 | 2 | No | Weekly | Daily | Daily | Daily | Weekly | Daily | Daily | Weekly |
| 34 | 2 | Yes | Weekly | Daily | Monthly | Weekly | Daily | Daily | Daily | Daily |
| 35 | 2 | No | Never | Daily | Weekly | Monthly | Weekly | Daily | Daily | Monthly |
| 36 | 2 | No | Weekly | Daily | Monthly | Weekly | Weekly | Monthly | Daily | Weekly |
| 37 | 2 | Yes | Monthly | Daily | Monthly | Weekly | Weekly | Daily | Daily | Weekly |
| 38 | 2 | No | Monthly | Daily | Monthly | Weekly | Monthly | Daily | Daily | Weekly |
| 39 | 2 | No | Weekly | Daily | Weekly | Daily | Weekly | Daily | Daily | Weekly |
| 40 | 2 | Yes | Weekly | Daily | Weekly | Weekly | Weekly | Monthly | Daily | Daily |
| 41 | 2 | No | Monthly | Daily | Weekly | Daily | Weekly | Daily | Daily | Monthly |
| 42 | 2 | No | Monthly | Daily | Monthly | Weekly | Weekly | Daily | Daily | Daily |
| 43 | 2 | No | Weekly | Daily | Daily | Weekly | Weekly | Daily | Daily | Daily |
| 44 | 2 | No | Monthly | Daily | Daily | Weekly | Daily | Daily | Daily | Weekly |
| 45 | 2 | No | Weekly | Daily | Weekly | Weekly | Daily | Daily | Daily | Daily |
| 48 | 2 | No | Monthly | Daily | Monthly | Weekly | Weekly | Weekly | Monthly | Never |
| 49 | 2 | No | Weekly | Daily | Weekly | Daily | Weekly | Daily | Daily | Daily |
| 50 | 2 | No | Weekly | Daily | Weekly | Weekly | Weekly | Daily | Daily | Weekly |
| 53 | 3 | Yes | Monthly | Daily | Weekly | Monthly | Daily | Daily | Daily | Daily |
| 55 | 2 | Yes | Never | Daily | Weekly | Daily | Weekly | Daily | Daily | Daily |
| 56 | 2 | Yes | Monthly | Daily | Weekly | Daily | Daily | Daily | Daily | Daily |
| 57 | 2 | Yes | Weekly | Daily | Weekly | Weekly | Weekly | Daily | Weekly | Daily |
| 58 | 2 | Yes | Monthly | Daily | Monthly | Daily | Weekly | Daily | Daily | Monthly |
| 59 | 2 | No | Weekly | Daily | Weekly | Daily | Daily | Daily | Daily | Daily |
| 60 | 2 | No | Weekly | Daily | Weekly | Daily | Weekly | Daily | Daily | Weekly |
| 61 | 2 | No | Weekly | Daily | Weekly | Weekly | Weekly | Daily | Daily | Weekly |
| 62 | 3 | Yes | Daily | Daily | Monthly | Daily | Weekly | Daily | Daily | Daily |
| 63 | 3 | Yes | Daily | Daily | Monthly | Daily | Weekly | Daily | Daily | Daily |
| 64 | 2 | Yes | Weekly | Daily | Monthly | Weekly | Daily | Daily | Daily | Weekly |
| 65 | 2 | Yes | Weekly | Daily | Monthly | Daily | Weekly | Daily | Daily | Daily |
| 66 | 2 | Yes | Weekly | Daily | Monthly | Daily | Weekly | Daily | Daily | Weekly |
| 69 | 2 | No | Weekly | Daily | Weekly | Weekly | Daily | Daily | Daily | Weekly |
| 71 | 3 | Yes | Weekly | Daily | Weekly | Weekly | Weekly | Daily | Daily | Weekly |
| 74 | 3 | Yes | Weekly | Daily | Weekly | Daily | Weekly | Daily | Daily | Weekly |
| 76 | 3 | Yes | Weekly | Weekly | Monthly | Daily | Weekly | Daily | Daily | Monthly |
| 79 | 2 | No | Monthly | Daily | Monthly | Weekly | Weekly | Daily | Daily | Weekly |
| 80 | 2 | No | Weekly | Daily | Daily | Weekly | Weekly | Daily | Never | Weekly |
| 83 | 4 | Yes | Daily | Weekly | Daily | Daily | Daily | Daily | Daily | Daily |
| 87 | 2 | Yes | Weekly | Daily | Weekly | Daily | Weekly | Daily | Daily | Daily |
| 89 | 4 | Yes | Daily | Weekly | Daily | Daily | Daily | Daily | Daily | Daily |
| 95 | 3 | Yes | Daily | Daily | Monthly | Daily | Weekly | Daily | Daily | Weekly |
| 97 | 3 | Yes | Monthly | Daily | Monthly | Daily | Weekly | Daily | Daily | Daily |
| 107 | 3 | Yes | Weekly | Daily | Weekly | Weekly | Daily | Daily | Daily | Weekly |
| 109 | 2 | No | Weekly | Daily | Daily | Daily | Daily | Daily | Daily | Daily |
| 111 | 3 | No | Weekly | Daily | Monthly | Daily | Daily | Daily | Daily | Weekly |
| 112 | 2 | No | Monthly | Daily | Weekly | Daily | Daily | Daily | Daily | Weekly |
| 118 | 3 | No | Daily | Daily | Weekly | Weekly | Daily | Weekly | Daily | Daily |
| 123 | 2 | No | Weekly | Daily | Monthly | Weekly | Daily | Daily | Daily | Weekly |
| 130 | 3 | Yes | Daily | Daily | Daily | Daily | Daily | Daily | Daily | Weekly |
| 133 | 3 | Yes | Monthly | Daily | Weekly | Daily | Weekly | Daily | Daily | Daily |
| 140 | 3 | Yes | Weekly | Daily | Monthly | Daily | Daily | Daily | Daily | Weekly |
| 142 | 3 | No | Monthly | Daily | Weekly | Weekly | Weekly | Daily | Daily | Monthly |
| 143 | 2 | No | Weekly | Daily | Weekly | Daily | Never | Monthly | Daily | Weekly |
| 144 | 2 | No | Monthly | Daily | Monthly | Weekly | Weekly | Daily | Daily | Weekly |
| 145 | 3 | Yes | Daily | Daily | Weekly | Weekly | Weekly | Daily | Daily | Monthly |
| 146 | 2 | No | Weekly | Daily | Monthly | Monthly | Daily | Daily | Weekly | Weekly |
| 147 | 2 | No | Weekly | Daily | Weekly | Monthly | Daily | Monthly | Daily | Monthly |
| 148 | 2 | No | Weekly | Daily | Weekly | Weekly | Daily | Daily | Daily | Weekly |
| 149 | 2 | No | Weekly | Daily | Weekly | Weekly | Weekly | Weekly | Daily | Monthly |
| 150 | 2 | No | Weekly | Daily | Daily | Daily | Monthly | Daily | Weekly | Weekly |
| 151 | 2 | No | Weekly | Never | Weekly | Monthly | Daily | Daily | Weekly | Daily |
| 152 | 2 | Yes | Monthly | Daily | Daily | Weekly | Weekly | Daily | Daily | Daily |
| 153 | 4 | Yes | Daily | Daily | Monthly | Daily | Daily | Daily | Monthly | Daily |
| 154 | 2 | No | Monthly | Daily | Weekly | Monthly | Monthly | Daily | Daily | Weekly |
| 155 | 2 | No | Monthly | Weekly | Monthly | Monthly | Weekly | Daily | Daily | Daily |
| 156 | 2 | No | Weekly | Daily | Weekly | Weekly | Weekly | Daily | Weekly | Weekly |
| 157 | 2 | No | Weekly | Weekly | Monthly | Daily | Monthly | Weekly | Daily | Weekly |
| 158 | 2 | No | Weekly | Daily | Weekly | Daily | Daily | Daily | Daily | Daily |
| 159 | 3 | Yes | Never | Daily | Never | Daily | Weekly | Weekly | Daily | Weekly |
| 160 | 3 | Yes | Monthly | Daily | Monthly | Weekly | Monthly | Daily | Daily | Weekly |
| 161 | 2 | No | Weekly | Daily | Monthly | Weekly | Weekly | Daily | Daily | Daily |
| 162 | 2 | No | Weekly | Daily | Weekly | Daily | Daily | Daily | Daily | Weekly |
| 163 | 2 | No | Monthly | Daily | Weekly | Weekly | Weekly | Daily | Daily | Monthly |
| 164 | 3 | Yes | Monthly | Daily | Weekly | Daily | Weekly | Daily | Daily | Weekly |
| 165 | 3 | Yes | Daily | Daily | Weekly | Weekly | Weekly | Daily | Daily | Weekly |
| 166 | 3 | Yes | Monthly | Daily | Monthly | Weekly | Weekly | Daily | Daily | Weekly |
| 167 | 3 | Yes | Weekly | Daily | Weekly | Weekly | Weekly | Daily | Daily | Daily |
| 168 | 2 | Yes | Weekly | Monthly | Daily | Daily | Weekly | Daily | Daily | Daily |
| 169 | 2 | No | Monthly | Daily | Weekly | Daily | Daily | Daily | Daily | Weekly |
| 171 | 1 | No | Weekly | Daily | Weekly | Monthly | Daily | Weekly | Daily | Daily |
| 172 | 2 | No | Monthly | Daily | Weekly | Weekly | Monthly | Daily | Weekly | Weekly |
| 176 | 4 | Yes | Daily | Daily | Monthly | Weekly | Weekly | Daily | Daily | Weekly |
| 181 | 3 | No | Monthly | Daily | Weekly | Daily | Weekly | Daily | Daily | Weekly |
| 182 | 2 | Yes | Monthly | Daily | Monthly | Weekly | Monthly | Daily | Weekly | Weekly |
| 183 | 3 | No | Monthly | Daily | Monthly | Weekly | Monthly | Daily | Weekly | Weekly |
| 184 | 2 | No | Weekly | Daily | Weekly | Daily | Weekly | Weekly | Daily | Daily |
| 185 | 2 | Yes | Weekly | Daily | Weekly | Daily | Daily | Daily | Daily | Weekly |
| 186 | 2 | No | Weekly | Daily | Daily | Daily | Daily | Daily | Daily | Weekly |
| 187 | 3 | Yes | Monthly | Daily | Daily | Weekly | Weekly | Daily | Daily | Weekly |
| 188 | 2 | No | Weekly | Daily | Weekly | Weekly | Daily | Daily | Daily | Daily |
| 189 | 3 | No | Weekly | Daily | Weekly | Monthly | Monthly | Daily | Daily | Weekly |
| 190 | 3 | No | Weekly | Daily | Monthly | Daily | Weekly | Weekly | Daily | Weekly |
| 191 | 2 | Yes | Weekly | Daily | Daily | Weekly | Daily | Daily | Weekly | Weekly |
| 192 | 2 | No | Daily | Daily | Daily | Weekly | Daily | Weekly | Daily | Daily |
| 193 | 2 | No | Weekly | Daily | Weekly | Daily | Weekly | Weekly | Daily | Daily |
| 194 | 3 | Yes | Weekly | Daily | Weekly | Daily | Weekly | Daily | Daily | Daily |
| 195 | 3 | Yes | Weekly | Daily | Weekly | Weekly | Weekly | Daily | Daily | Weekly |
| 196 | 2 | No | Weekly | Weekly | Weekly | Weekly | Monthly | Daily | Weekly | Daily |
| 197 | 3 | Yes | Weekly | Daily | Weekly | Weekly | Weekly | Daily | Never | Weekly |
| 198 | 3 | Yes | Weekly | Daily | Monthly | Weekly | Daily | Daily | Daily | Daily |
| 199 | 2 | No | Monthly | Daily | Monthly | Weekly | Weekly | Daily | Daily | Never |
| 200 | 2 | No | Monthly | Daily | Monthly | Weekly | Daily | Daily | Daily | Weekly |
| 201 | 2 | Yes | Weekly | Daily | Weekly | Weekly | Monthly | Daily | Weekly | Weekly |
| 202 | 2 | No | Weekly | Daily | Weekly | Weekly | Weekly | Weekly | Daily | Daily |
| 203 | 2 | No | Monthly | Daily | Monthly | Monthly | Weekly | Weekly | Daily | Monthly |
Block A4 of 4 – variables: Carbonated_drinks_frequency to Anaemia_status_WHO
| Participant_ID | Carbonated_drinks_frequency | Systolic_BP_mmHg | Diastolic_BP_mmHg | BP_category | Capillary_glycaemia_g_L | Glycaemia_category | Haemoglobin_g_dL | Anaemia_status_WHO |
|---|---|---|---|---|---|---|---|---|
| 1 | Weekly | 120 | 80 | Normal | 0.97 | Normal | 10.1 | Anaemia |
| 2 | Monthly | 120 | 80 | Normal | 0.92 | Normal | 14.3 | No anaemia |
| 3 | Weekly | 100 | 70 | Normal | 0.95 | Normal | 13.3 | No anaemia |
| 4 | Monthly | 140 | 100 | Hypertension | 1.04 | Normal | 17.9 | No anaemia |
| 5 | Never | 100 | 70 | Normal | 0.7 | Normal | 14.8 | No anaemia |
| 7 | Weekly | 110 | 80 | Normal | 0.86 | Normal | 12.5 | No anaemia |
| 8 | Daily | 110 | 70 | Normal | 0.92 | Normal | 13.3 | No anaemia |
| 9 | Weekly | 130 | 90 | Hypertension | 0.9 | Normal | 14.9 | No anaemia |
| 10 | Weekly | 130 | 90 | Hypertension | 0.97 | Normal | 9.04 | Anaemia |
| 11 | Monthly | 110 | 70 | Normal | 0.92 | Normal | 16.1 | No anaemia |
| 12 | Weekly | 110 | 70 | Normal | 0.95 | Normal | 16.3 | No anaemia |
| 16 | Weekly | 120 | 80 | Normal | 0.92 | Normal | 13.8 | No anaemia |
| 17 | Monthly | 110 | 80 | Normal | 0.86 | Normal | 14.5 | No anaemia |
| 18 | Weekly | 120 | 70 | Normal | 0.86 | Normal | 15.9 | No anaemia |
| 19 | Monthly | 120 | 70 | Normal | 0.9 | Normal | 13.3 | No anaemia |
| 22 | Weekly | 120 | 80 | Normal | 1.17 | Hyperglycaemia | 10.8 | Anaemia |
| 23 | Monthly | 120 | 90 | Hypertension | 1.08 | Normal | 8.5 | Anaemia |
| 24 | Monthly | 130 | 80 | Normal | 0.9 | Normal | 13.9 | No anaemia |
| 25 | Monthly | 110 | 90 | Hypertension | 0.86 | Normal | 12.7 | No anaemia |
| 26 | Weekly | 120 | 70 | Normal | 0.81 | Normal | 17.6 | No anaemia |
| 27 | Weekly | 100 | 80 | Normal | 0.97 | Normal | 13.0 | No anaemia |
| 28 | Weekly | 100 | 80 | Normal | 0.94 | Normal | 12.5 | No anaemia |
| 29 | Weekly | 100 | 80 | Normal | 0.9 | Normal | 12.9 | No anaemia |
| 30 | Weekly | 100 | 70 | Normal | 0.95 | Normal | 13.9 | No anaemia |
| 31 | Weekly | 110 | 70 | Normal | 12.1 | Anaemia | ||
| 32 | Weekly | 110 | 70 | Normal | 0.94 | Normal | 14.7 | No anaemia |
| 33 | Weekly | 110 | 70 | Normal | 0.85 | Normal | 15.4 | No anaemia |
| 34 | Weekly | 100 | 80 | Normal | 0.72 | Normal | 15.3 | No anaemia |
| 35 | Monthly | 120 | 70 | Normal | 0.85 | Normal | 16.1 | No anaemia |
| 36 | Weekly | 100 | 70 | Normal | 0.83 | Normal | 15.5 | No anaemia |
| 37 | Monthly | 100 | 70 | Normal | 0.81 | Normal | 15.6 | No anaemia |
| 38 | Monthly | 120 | 80 | Normal | 0.86 | Normal | 16.5 | No anaemia |
| 39 | Weekly | 110 | 80 | Normal | 0.79 | Normal | 12.5 | No anaemia |
| 40 | Weekly | 110 | 70 | Normal | 0.72 | Normal | 15.3 | No anaemia |
| 41 | Weekly | 120 | 70 | Normal | 0.83 | Normal | 14.9 | No anaemia |
| 42 | Monthly | 110 | 70 | Normal | 0.9 | Normal | 15.9 | No anaemia |
| 43 | Weekly | 130 | 90 | Hypertension | 0.88 | Normal | 17.8 | No anaemia |
| 44 | Monthly | 120 | 70 | Normal | 0.86 | Normal | 16.9 | No anaemia |
| 45 | Weekly | 130 | 80 | Normal | 0.7 | Normal | 15.6 | No anaemia |
| 48 | Monthly | 110 | 70 | Normal | 1.03 | Normal | 13.0 | No anaemia |
| 49 | Weekly | 130 | 70 | Normal | 1.1 | Normal | 16.4 | No anaemia |
| 50 | Weekly | 100 | 70 | Normal | 0.68 | Hypoglycaemia | 13.1 | No anaemia |
| 53 | Monthly | 100 | 60 | Normal | 0.83 | Normal | 17.4 | No anaemia |
| 55 | Weekly | 120 | 70 | Normal | 0.86 | Normal | 13.8 | No anaemia |
| 56 | Weekly | 150 | 70 | Hypertension | 0.79 | Normal | 15.2 | No anaemia |
| 57 | Weekly | 120 | 70 | Normal | 0.83 | Normal | 14.2 | No anaemia |
| 58 | Monthly | 110 | 70 | Normal | 0.9 | Normal | 13.0 | No anaemia |
| 59 | Weekly | 100 | 70 | Normal | 0.7 | Normal | 13.8 | No anaemia |
| 60 | Monthly | 100 | 70 | Normal | 0.97 | Normal | 13.7 | No anaemia |
| 61 | Monthly | 140 | 70 | Hypertension | 0.63 | Hypoglycaemia | 17.8 | No anaemia |
| 62 | Weekly | 110 | 60 | Normal | 0.79 | Normal | 15.0 | No anaemia |
| 63 | Weekly | 90 | 70 | Normal | 0.83 | Normal | 12.8 | No anaemia |
| 64 | Monthly | 0.72 | Normal | 17.2 | No anaemia | |||
| 65 | Weekly | 110 | 70 | Normal | 0.97 | Normal | 8.7 | Anaemia |
| 66 | Weekly | 120 | 80 | Normal | 0.9 | Normal | 13.5 | No anaemia |
| 69 | Weekly | 110 | 70 | Normal | 0.81 | Normal | 12.6 | No anaemia |
| 71 | Monthly | 100 | 70 | Normal | 0.99 | Normal | 13.7 | No anaemia |
| 74 | Monthly | 100 | 60 | Normal | 0.9 | Normal | 11.9 | Anaemia |
| 76 | Monthly | 120 | 80 | Normal | 0.89 | Normal | 9.8 | Anaemia |
| 79 | Monthly | 100 | 50 | Hypotension | 0.88 | Normal | 12.4 | Anaemia |
| 80 | Monthly | 120 | 70 | Normal | 0.92 | Normal | 14.2 | No anaemia |
| 83 | Never | 140 | 90 | Hypertension | 0.99 | Normal | 11.9 | Anaemia |
| 87 | Daily | 120 | 70 | Normal | 1.0 | Normal | 13.3 | No anaemia |
| 89 | Never | 140 | 90 | Hypertension | 0.92 | Normal | 11.9 | Anaemia |
| 95 | Monthly | 120 | 70 | Normal | 0.99 | Normal | 9.2 | Anaemia |
| 97 | Weekly | 120 | 70 | Normal | 0.81 | Normal | 12.8 | No anaemia |
| 107 | Weekly | 120 | 70 | Normal | 0.89 | Normal | 12.3 | No anaemia |
| 109 | Weekly | 110 | 70 | Normal | 1.03 | Normal | 11.3 | Anaemia |
| 111 | Weekly | 110 | 70 | Normal | 0.98 | Normal | 9.4 | Anaemia |
| 112 | Weekly | 120 | 40 | Hypotension | 1.0 | Normal | 13.3 | No anaemia |
| 118 | Weekly | 110 | 70 | Normal | 0.91 | Normal | 13.9 | No anaemia |
| 123 | Monthly | 100 | 70 | Normal | 0.92 | Normal | 14.7 | No anaemia |
| 130 | Weekly | 110 | 50 | Hypotension | 12.4 | No anaemia | ||
| 133 | Weekly | 120 | 80 | Normal | 0.97 | Normal | 12.6 | No anaemia |
| 140 | Monthly | 0.99 | Normal | 6.0 | Anaemia | |||
| 142 | Monthly | 160 | 70 | Hypertension | 0.87 | Normal | 10.4 | Anaemia |
| 143 | Monthly | 110 | 70 | Normal | 0.96 | Normal | 13.0 | No anaemia |
| 144 | Monthly | 120 | 70 | Normal | 0.97 | Normal | 15.1 | No anaemia |
| 145 | Never | 100 | 60 | Normal | 0.88 | Normal | 13.8 | No anaemia |
| 146 | Monthly | 100 | 60 | Normal | 0.92 | Normal | 13.5 | No anaemia |
| 147 | Never | 120 | 70 | Normal | 0.91 | Normal | 10.8 | Anaemia |
| 148 | Monthly | 100 | 60 | Normal | 1.1 | Normal | 14.1 | No anaemia |
| 149 | Monthly | 100 | 70 | Normal | 1.11 | Hyperglycaemia | 10.5 | Anaemia |
| 150 | Monthly | 120 | 70 | Normal | 1.01 | Normal | 15.8 | No anaemia |
| 151 | Daily | 120 | 80 | Normal | 1.01 | Normal | 15.4 | No anaemia |
| 152 | Weekly | 130 | 80 | Normal | 0.96 | Normal | 15.9 | No anaemia |
| 153 | Daily | 120 | 80 | Normal | 0.95 | Normal | 13.8 | No anaemia |
| 154 | Weekly | 110 | 70 | Normal | 0.92 | Normal | 13.4 | No anaemia |
| 155 | Weekly | 100 | 70 | Normal | 0.97 | Normal | 12.7 | Anaemia |
| 156 | Weekly | 120 | 80 | Normal | 0.88 | Normal | 15.5 | No anaemia |
| 157 | Monthly | 120 | 80 | Normal | 0.89 | Normal | 14.7 | No anaemia |
| 158 | Weekly | 120 | 80 | Normal | 1.0 | Normal | 14.7 | No anaemia |
| 159 | Weekly | 130 | 80 | Normal | 0.92 | Normal | 14.4 | No anaemia |
| 160 | Weekly | 100 | 60 | Normal | 0.87 | Normal | 12.9 | Anaemia |
| 161 | Weekly | 100 | 70 | Normal | 0.92 | Normal | 14.6 | No anaemia |
| 162 | Weekly | 130 | 70 | Normal | 0.87 | Normal | 14.1 | No anaemia |
| 163 | Monthly | 110 | 70 | Normal | 0.9 | Normal | 12.4 | Anaemia |
| 164 | Weekly | 140 | 80 | Hypertension | 0.98 | Normal | 15.9 | No anaemia |
| 165 | Monthly | 130 | 70 | Normal | 0.89 | Normal | 14.4 | No anaemia |
| 166 | Monthly | 110 | 80 | Normal | 0.92 | Normal | 13.7 | No anaemia |
| 167 | Weekly | 120 | 80 | Normal | 0.88 | Normal | 12.4 | No anaemia |
| 168 | Weekly | 100 | 70 | Normal | 0.95 | Normal | 15.3 | No anaemia |
| 169 | Weekly | 130 | 70 | Normal | 1.03 | Normal | 13.2 | No anaemia |
| 171 | Never | 110 | 70 | Normal | 0.91 | Normal | 11.2 | Anaemia |
| 172 | Weekly | 100 | 70 | Normal | 0.77 | Normal | 15.3 | No anaemia |
| 176 | Weekly | 120 | 80 | Normal | 0.88 | Normal | 10.0 | Anaemia |
| 181 | Weekly | 120 | 70 | Normal | 0.95 | Normal | 13.0 | No anaemia |
| 182 | Weekly | 100 | 70 | Normal | 1.0 | Normal | 6.2 | Anaemia |
| 183 | Weekly | 110 | 60 | Normal | 0.92 | Normal | 14.2 | No anaemia |
| 184 | Weekly | 110 | 70 | Normal | 1.04 | Normal | 12.4 | Anaemia |
| 185 | Weekly | 110 | 70 | Normal | 1.2 | Hyperglycaemia | 18.8 | No anaemia |
| 186 | Weekly | 130 | 80 | Normal | 0.96 | Normal | 9.5 | Anaemia |
| 187 | Weekly | 110 | 70 | Normal | 1.08 | Normal | 7.7 | Anaemia |
| 188 | Weekly | 120 | 80 | Normal | 0.85 | Normal | 5.9 | Anaemia |
| 189 | Weekly | 110 | 70 | Normal | 0.82 | Normal | 6.8 | Anaemia |
| 190 | Monthly | 110 | 70 | Normal | 0.78 | Normal | 5.7 | Anaemia |
| 191 | Monthly | 120 | 90 | Hypertension | 0.96 | Normal | 12.4 | Anaemia |
| 192 | Daily | 130 | 90 | Hypertension | 0.93 | Normal | 6.8 | Anaemia |
| 193 | Weekly | 120 | 70 | Normal | 0.96 | Normal | 10.4 | Anaemia |
| 194 | Daily | 150 | 90 | Hypertension | 1.08 | Normal | 13.4 | No anaemia |
| 195 | Weekly | 120 | 70 | Normal | 0.92 | Normal | 13.1 | No anaemia |
| 196 | Monthly | 110 | 70 | Normal | 0.99 | Normal | 12.3 | Anaemia |
| 197 | Weekly | 100 | 70 | Normal | 0.9 | Normal | 8.2 | Anaemia |
| 198 | Weekly | 90 | 70 | Normal | 0.76 | Normal | 10.6 | Anaemia |
| 199 | Never | 100 | 70 | Normal | 0.85 | Normal | 10.8 | Anaemia |
| 200 | Weekly | 130 | 90 | Hypertension | 0.98 | Normal | 13.5 | No anaemia |
| 201 | Daily | 110 | 70 | Normal | 0.95 | Normal | 14.4 | No anaemia |
| 202 | Weekly | 120 | 70 | Normal | 0.97 | Normal | 15.9 | No anaemia |
| 203 | Daily | 130 | 90 | Hypertension | 0.87 | Normal | 13.3 | No anaemia |
Part B – Codebook
| Variable | Description | Unit / Coding |
|---|---|---|
| Participant_ID | Anonymous participant identifier (original survey form number; not renumbered, hence non-contiguous) | integer, 1-203 (129 participants) |
| Sex | Biological sex | Male / Female |
| Age_years | Age at time of survey | years |
| Marital_status | Self-reported marital status | Single / Married / Divorced |
| Year_of_study | Undergraduate year of study | L1 / L2 / L3 (Year 1/2/3) |
| Accommodation | Type of accommodation | Rented / Family home / University dormitory |
| Faculty_department | Department within the Faculty of Science and Technology | text |
| Income_source | Main reported source of income | categorical, see manuscript Table 1 |
| Perceived_living_conditions | Self-rated living conditions | Acceptable / Average / Good / Precarious |
| Weight_kg | Body weight | kg |
| Height_m | Standing height | m |
| BMI_kg_m2 | Body mass index = weight/height² | kg/m² |
| BMI_category_WHO | Nutritional status per WHO BMI cut-offs | Thinness (<18.5) / Normal weight (18.5-24.9) / Overweight (25-29.9) / Obesity (>=30) |
| MUAC_cm | Mid-upper arm circumference | cm |
| Physical_activity_yn | Practises any physical activity | Yes / No |
| Physical_activity_type | Type of physical activity reported | free text |
| Physical_activity_frequency | Frequency of physical activity | Regular / Irregular / Occasional / None |
| Alcohol_consumption_yn | Reports alcohol consumption | Yes / No |
| Tobacco_use_yn | Reports tobacco use | Yes / No |
| Tea_coffee_consumption_yn | Reports tea or coffee consumption | Yes / No |
| Tea_coffee_frequency | Frequency of tea/coffee consumption | Daily / Weekly / Occasional / None |
| Meals_per_day | Number of meals eaten per day | integer, 1-4+ |
| Breakfast_consumption_yn | Eats breakfast | Yes / No |
| Milk_dairy_frequency | Consumption frequency: milk & dairy products | Daily / Weekly / Monthly / Never |
| Cereals_starches_frequency | Consumption frequency: cereals & starches | Daily / Weekly / Monthly / Never |
| Pulses_frequency | Consumption frequency: pulses (legumes) | Daily / Weekly / Monthly / Never |
| Meat_fish_eggs_frequency | Consumption frequency: meat/fish/eggs | Daily / Weekly / Monthly / Never |
| Fruit_frequency | Consumption frequency: fruit | Daily / Weekly / Monthly / Never |
| Vegetables_frequency | Consumption frequency: vegetables | Daily / Weekly / Monthly / Never |
| Fats_frequency | Consumption frequency: fats/oils | Daily / Weekly / Monthly / Never |
| Sugary_products_frequency | Consumption frequency: sugary products | Daily / Weekly / Monthly / Never |
| Carbonated_drinks_frequency | Consumption frequency: carbonated drinks | Daily / Weekly / Monthly / Never |
| Systolic_BP_mmHg | Systolic blood pressure (blank = excluded as implausible, n=2 missing) | mmHg |
| Diastolic_BP_mmHg | Diastolic blood pressure (blank = excluded as implausible, n=2 missing) | mmHg |
| BP_category | Blood pressure category (systolic >=140 and/or diastolic >=90 = Hypertension; systolic <90 or diastolic <60 = Hypotension) | Normal / Hypertension / Hypotension |
| Capillary_glycaemia_g_L | Capillary blood glucose (blank = one outlier + one missing excluded) | g/L |
| Glycaemia_category | Glycaemia category (<0.70 g/L = Hypoglycaemia; >1.10 g/L = Hyperglycaemia) | Normal / Hyperglycaemia / Hypoglycaemia |
| Haemoglobin_g_dL | Haemoglobin concentration | g/dL |
| Anaemia_status_WHO | Anaemia status per WHO sex-specific thresholds (Hb <12 g/dL women; <13 g/dL men) | No anaemia / Anaemia |
Supplementary Data S2: Python Analysis Script
International Journal of Scientific Research and Management (IJSRM)
Dietary Habits and Nutritional Status of Undergraduate Students at the University of Labé, Republic of Guinea: A Descriptive and Analytical Cross-Sectional Study
Description
This script reproduces, from the anonymised raw data (Supplementary File 1, sheet “Raw_Data”), every statistic reported in the manuscript: descriptive statistics (Tables 1–3), bivariate association tests (Table 4; Welch’s t-test, Pearson’s chi-square test, Pearson correlation), Wilson score 95% confidence intervals, and the multivariable logistic regression model (Sections 3.5 and 4).
Requirements: Python ≥ 3.9; pandas, numpy, scipy, statsmodels, openpyxl.
Usage: python IJSRM_Analysis_Script06102026.py --input IJSRM_Supplementary_Raw_Data06102026.xlsx
The executable script is also provided as IJSRM_Analysis_Script06102026.py.
Source code
1 #!/usr/bin/env python3
2 # -*- coding: utf-8 -*-
3 """
4 IJSRM_Analysis_Script06102026.py
5
6 Reproducible analysis script for:
7 "Dietary Habits and Nutritional Status of Undergraduate Students at the
8 University of Labe, Republic of Guinea"
9
10 This script reproduces, from the openly shared raw data (Supplementary
11 File 1, sheet "Raw_Data"), every statistic reported in the manuscript:
12 - Descriptive statistics (Tables 1-3)
13 - Bivariate association tests (Table 4): Welch's t-test, Pearson's
14 chi-square test, Pearson correlation coefficient
15 - Wilson score 95% confidence intervals for all reported proportions
16 - The multivariable logistic regression model (Section 3.5 / 4)
17
18 Requirements:
19 python >= 3.9
20 pandas, numpy, scipy, statsmodels, openpyxl
21
22 Usage:
23 python IJSRM_Analysis_Script06102026.py --input IJSRM_Supplementary_Raw_Data06102026.xlsx
24
25 Author: corresponding author's analysis team
26 """
27
28 import argparse
29 import numpy as np
30 import pandas as pd
31 from scipy import stats
32 import statsmodels.formula.api as smf
33
34
35 # ---------------------------------------------------------------------------
36 # 1. Utility functions
37 # ---------------------------------------------------------------------------
38
39 def wilson_ci(k, n, z=1.959963985):
40 """Wilson score 95% confidence interval for a binomial proportion.
41
42 Parameters
43 ----------
44 k : int
45 Number of "successes" (events).
46 n : int
47 Total number of observations.
48 z : float
49 Critical value of the standard normal distribution for the
50 desired confidence level (default: 1.959963985 for 95%).
51
52 Returns
53 -------
54 (p, low, high) : tuple of floats
55 Observed proportion and lower/upper bounds of the 95% CI,
56 all expressed as percentages.
57 """
58 if n == 0:
59 return (np.nan, np.nan, np.nan)
60 p_hat = k / n
61 denom = 1 + z ** 2 / n
62 centre = p_hat + z ** 2 / (2 * n)
63 adj = z * np.sqrt((p_hat * (1 - p_hat) + z ** 2 / (4 * n)) / n)
64 low = (centre - adj) / denom
65 high = (centre + adj) / denom
66 return (p_hat * 100, max(0, low) * 100, min(1, high) * 100)
67
68
69 def describe_prop(series, value, label=None):
70 """Print n, %, and 95% Wilson CI for `series == value`."""
71 n_total = series.notna().sum()
72 k = (series == value).sum()
73 p, lo, hi = wilson_ci(k, n_total)
74 label = label or f"{series.name} = {value}"
75 print(f" {label}: {k}/{n_total} ({p:.1f}%) [95% CI {lo:.1f}-{hi:.1f}]")
76 return k, n_total, p, lo, hi
77
78
79 def welch_ttest(a, b, label=""):
80 """Welch's (unequal-variance) t-test, as used throughout the manuscript."""
81 a = a.dropna()
82 b = b.dropna()
83 t, p = stats.ttest_ind(a, b, equal_var=False)
84 print(f" {label}: mean_1={a.mean():.2f} (SD {a.std():.2f}, n={len(a)}), "
85 f"mean_2={b.mean():.2f} (SD {b.std():.2f}, n={len(b)}), "
86 f"t={t:.2f}, P={p:.3f}")
87 return t, p
88
89
90 def chi2_test(df, col1, col2, label=""):
91 """Pearson's chi-square test of independence between two categorical columns."""
92 ct = pd.crosstab(df[col1], df[col2])
93 chi2, p, dof, _ = stats.chi2_contingency(ct)
94 print(f" {label}: chi2({dof}) = {chi2:.2f}, P = {p:.3f}")
95 return chi2, p, dof
96
97
98 def pearson_r(a, b, label=""):
99 tmp = pd.concat([a, b], axis=1).dropna()
100 r, p = stats.pearsonr(tmp.iloc[:, 0], tmp.iloc[:, 1])
101 print(f" {label}: r = {r:.2f}, P = {p:.3g}")
102 return r, p
103
104
105 # ---------------------------------------------------------------------------
106 # 2. Load and prepare data
107 # ---------------------------------------------------------------------------
108
109 def load_data(path):
110 df = pd.read_excel(path, sheet_name="Raw_Data")
111
112 # Derived binary/analysis variables (see manuscript Section 2.4 for
113 # operational definitions and Section 2.5 for the statistical model).
114 df["malnutrition"] = (df["BMI_category_WHO"] != "Normal weight").astype(int)
115 df["sex_female"] = (df["Sex"] == "Female").astype(int)
116 df["active"] = (df["Physical_activity_yn"] == "Yes").astype(int)
117 df["breakfast_yes"] = (df["Breakfast_consumption_yn"] == "Yes").astype(int)
118
119 return df
120
121
122 # ---------------------------------------------------------------------------
123 # 3. Descriptive statistics (Tables 1-3)
124 # ---------------------------------------------------------------------------
125
126 def descriptive_statistics(df):
127 print("\n" + "=" * 70)
128 print("DESCRIPTIVE STATISTICS (Tables 1-3)")
129 print("=" * 70)
130
131 n = len(df)
132 print(f"\nTotal sample: n = {n}")
133
134 print("\n-- Sex distribution --")
135 describe_prop(df["Sex"], "Male", "Male")
136 describe_prop(df["Sex"], "Female", "Female")
137
138 print("\n-- Age --")
139 print(f" Mean +/- SD: {df['Age_years'].mean():.1f} +/- {df['Age_years'].std():.1f} "
140 f"years (range {df['Age_years'].min()}-{df['Age_years'].max()})")
141 welch_ttest(df.loc[df.Sex == "Male", "Age_years"],
142 df.loc[df.Sex == "Female", "Age_years"],
143 "Age, men vs women")
144
145 print("\n-- Accommodation --")
146 for cat in df["Accommodation"].dropna().unique():
147 describe_prop(df["Accommodation"], cat, cat)
148
149 print("\n-- Anthropometric characteristics --")
150 print(f" Weight: {df['Weight_kg'].mean():.1f} +/- {df['Weight_kg'].std():.1f} kg")
151 print(f" Height: {df['Height_m'].mean():.2f} +/- {df['Height_m'].std():.2f} m")
152 welch_ttest(df.loc[df.Sex == "Male", "Weight_kg"],
153 df.loc[df.Sex == "Female", "Weight_kg"],
154 "Weight, men vs women")
155
156 print("\n-- Nutritional status (BMI, WHO categories) --")
157 for cat in ["Thinness", "Normal weight", "Overweight", "Obesity"]:
158 describe_prop(df["BMI_category_WHO"], cat, cat)
159 print(f" Malnutrition (any non-normal category): "
160 f"{df['malnutrition'].sum()}/{n} "
161 f"({100*df['malnutrition'].mean():.1f}%)")
162
163 print("\n-- MUAC vs BMI correlation --")
164 pearson_r(df["MUAC_cm"], df["BMI_kg_m2"], "MUAC vs BMI")
165
166 print("\n-- Clinical and biological parameters --")
167 print(f" Systolic BP: {df['Systolic_BP_mmHg'].mean():.1f} +/- "
168 f"{df['Systolic_BP_mmHg'].std():.1f} mmHg (n={df['Systolic_BP_mmHg'].notna().sum()})")
169 print(f" Diastolic BP: {df['Diastolic_BP_mmHg'].mean():.1f} +/- "
170 f"{df['Diastolic_BP_mmHg'].std():.1f} mmHg")
171 describe_prop(df["BP_category"], "Hypertension", "Hypertension")
172 describe_prop(df["BP_category"], "Hypotension", "Hypotension")
173 describe_prop(df["Glycaemia_category"], "Hyperglycaemia", "Hyperglycaemia")
174 describe_prop(df["Glycaemia_category"], "Hypoglycaemia", "Hypoglycaemia")
175 print(f" Haemoglobin: {df['Haemoglobin_g_dL'].mean():.1f} +/- "
176 f"{df['Haemoglobin_g_dL'].std():.1f} g/dL")
177 describe_prop(df["Anaemia_status_WHO"], "Anaemia", "Anaemia (overall)")
178 describe_prop(df.loc[df.Sex == "Female", "Anaemia_status_WHO"], "Anaemia", "Anaemia, women")
179 describe_prop(df.loc[df.Sex == "Male", "Anaemia_status_WHO"], "Anaemia", "Anaemia, men")
180
181 print("\n-- Dietary and behavioural habits --")
182 describe_prop(df["Breakfast_consumption_yn"], "No", "Breakfast skipping")
183 describe_prop(df["Meals_per_day"], 2, "2 meals/day")
184 describe_prop(df["Physical_activity_yn"], "Yes", "Physically active")
185 for col, label in [
186 ("Fruit_frequency", "Fruit - Daily"),
187 ("Pulses_frequency", "Pulses - Daily"),
188 ("Milk_dairy_frequency", "Dairy - Daily"),
189 ("Fats_frequency", "Fats - Daily"),
190 ("Sugary_products_frequency", "Sugary products - Daily"),
191 ]:
192 if col in df.columns:
193 describe_prop(df[col], "Daily", label)
194
195
196 # ---------------------------------------------------------------------------
197 # 4. Bivariate analyses (Table 4)
198 # ---------------------------------------------------------------------------
199
200 def bivariate_analyses(df):
201 print("\n" + "=" * 70)
202 print("BIVARIATE ANALYSES (Table 4)")
203 print("=" * 70)
204
205 print("\n-- Nutritional status vs sex --")
206 chi2_test(df, "BMI_category_WHO", "Sex", "Sex")
207
208 print("\n-- Nutritional status vs age (BMI as continuous, correlation) --")
209 pearson_r(df["Age_years"], df["BMI_kg_m2"], "Age vs BMI")
210
211 print("\n-- Nutritional status vs breakfast consumption --")
212 chi2_test(df, "BMI_category_WHO", "Breakfast_consumption_yn", "Breakfast consumption")
213
214 print("\n-- Nutritional status vs physical activity --")
215 chi2_test(df, "BMI_category_WHO", "Physical_activity_yn", "Physical activity")
216
217 print("\n-- Nutritional status vs accommodation --")
218 chi2_test(df, "BMI_category_WHO", "Accommodation", "Type of accommodation")
219
220 print("\n-- Nutritional status vs year of study --")
221 chi2_test(df, "BMI_category_WHO", "Year_of_study", "Year of study")
222
223 print("\n-- Nutritional status vs number of meals/day --")
224 pearson_r(df["Meals_per_day"], df["BMI_kg_m2"], "Meals/day vs BMI")
225
226 print("\n-- Nutritional status vs anaemia --")
227 chi2_test(df, "BMI_category_WHO", "Anaemia_status_WHO", "Nutritional status x anaemia")
228
229 print("\n-- Breakfast consumption vs anaemia --")
230 chi2_test(df, "Breakfast_consumption_yn", "Anaemia_status_WHO", "Breakfast x anaemia")
231
232
233 # ---------------------------------------------------------------------------
234 # 5. Multivariable logistic regression (Section 3.5 / 4)
235 # ---------------------------------------------------------------------------
236
237 def multivariable_model(df):
238 print("\n" + "=" * 70)
239 print("MULTIVARIABLE LOGISTIC REGRESSION")
240 print("=" * 70)
241 print("\nOutcome: malnutrition (1 = any BMI category other than 'Normal weight')")
242 print("Covariates: sex, age, breakfast consumption, physical activity, "
243 "type of accommodation, year of study\n")
244
245 model = smf.logit(
246 "malnutrition ~ sex_female + Age_years + breakfast_yes + active + "
247 "C(Accommodation) + C(Year_of_study)",
248 data=df,
249 ).fit(disp=0)
250
251 print(model.summary())
252
253 # Odds ratios and 95% confidence intervals
254 conf = model.conf_int()
255 conf.columns = ["2.5%", "97.5%"]
256 conf["coef"] = model.params
257 or_table = np.exp(conf[["coef", "2.5%", "97.5%"]])
258 or_table.columns = ["OR", "95%CI_low", "95%CI_high"]
259 or_table["P"] = model.pvalues
260
261 print("\n-- Adjusted odds ratios (95% CI) --")
262 print(or_table.round(3))
263
264 print(f"\nLikelihood-ratio test P-value: {model.llr_pvalue:.3f}")
265 print(f"Pseudo R-squared (McFadden): {model.prsquared:.3f}")
266
267 return model
268
269
270 # ---------------------------------------------------------------------------
271 # 6. Main
272 # ---------------------------------------------------------------------------
273
274 def main():
275 parser = argparse.ArgumentParser(description=__doc__)
276 parser.add_argument(
277 "--input",
278 default="IJSRM_Supplementary_Raw_Data06102026.xlsx",
279 help="Path to the Supplementary raw data Excel file (sheet 'Raw_Data').",
280 )
281 args = parser.parse_args()
282
283 df = load_data(args.input)
284 descriptive_statistics(df)
285 bivariate_analyses(df)
286 multivariable_model(df)
287
288
289 if __name__ == "__main__":
290 main()